Cypriot vs Senegalese Bachelor's Degree
COMPARE
Cypriot
Senegalese
Bachelor's Degree
Bachelor's Degree Comparison
Cypriots
Senegalese
49.0%
BACHELOR'S DEGREE
100.0/ 100
METRIC RATING
10th/ 347
METRIC RANK
37.5%
BACHELOR'S DEGREE
42.2/ 100
METRIC RATING
183rd/ 347
METRIC RANK
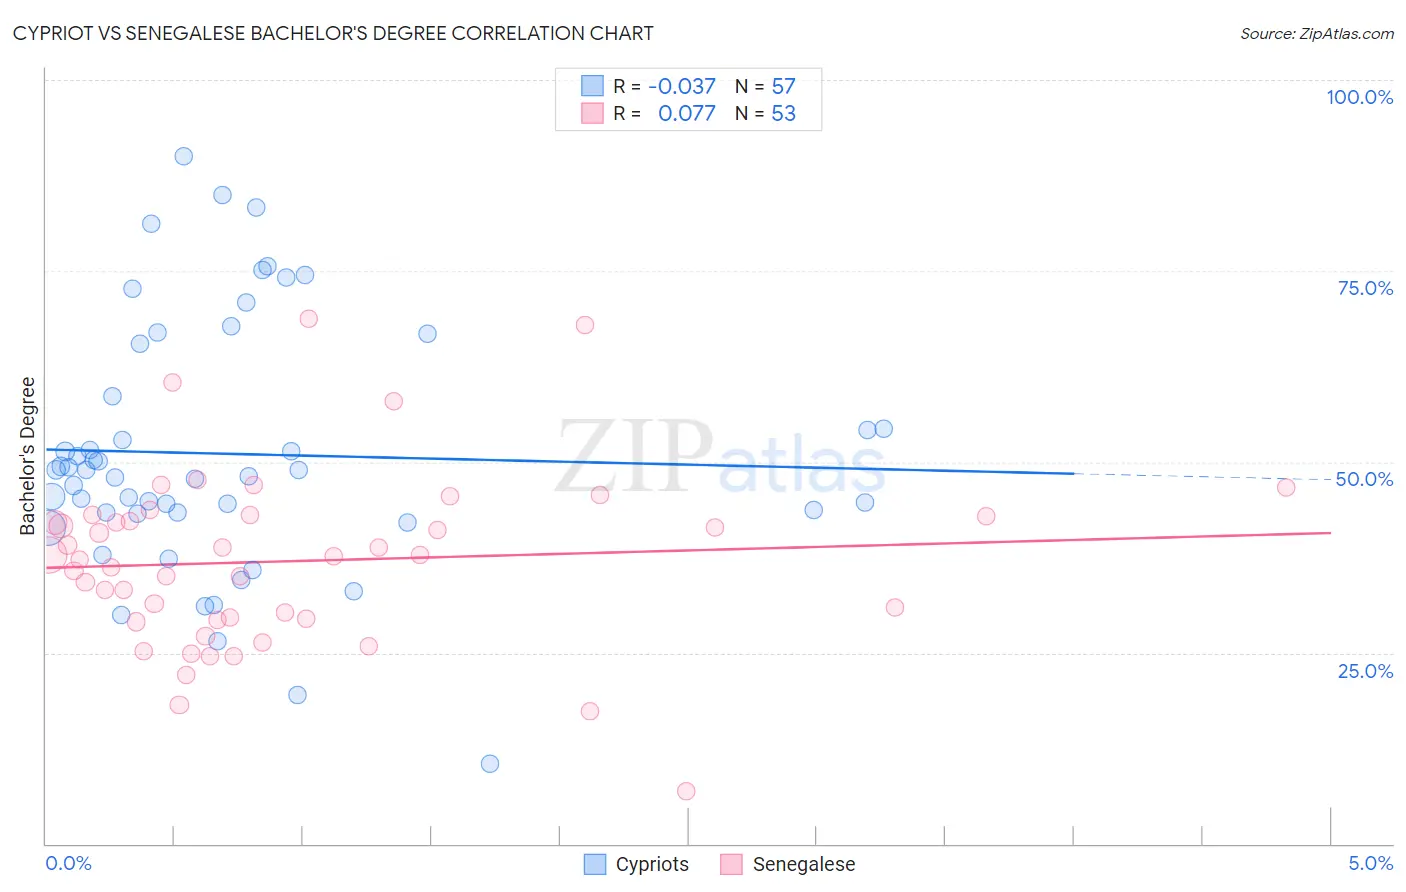
Cypriot vs Senegalese Bachelor's Degree Correlation Chart
The statistical analysis conducted on geographies consisting of 61,864,138 people shows no correlation between the proportion of Cypriots and percentage of population with at least bachelor's degree education in the United States with a correlation coefficient (R) of -0.037 and weighted average of 49.0%. Similarly, the statistical analysis conducted on geographies consisting of 78,136,633 people shows a slight positive correlation between the proportion of Senegalese and percentage of population with at least bachelor's degree education in the United States with a correlation coefficient (R) of 0.077 and weighted average of 37.5%, a difference of 30.7%.
Bachelor's Degree Correlation Summary
| Measurement | Cypriot | Senegalese |
| Minimum | 10.5% | 6.9% |
| Maximum | 90.0% | 68.8% |
| Range | 79.5% | 61.9% |
| Mean | 51.0% | 37.0% |
| Median | 48.9% | 37.6% |
| Interquartile 25% (IQ1) | 43.3% | 29.4% |
| Interquartile 75% (IQ3) | 62.0% | 42.9% |
| Interquartile Range (IQR) | 18.7% | 13.5% |
| Standard Deviation (Sample) | 16.5% | 11.6% |
| Standard Deviation (Population) | 16.3% | 11.5% |
Similar Demographics by Bachelor's Degree
Demographics Similar to Cypriots by Bachelor's Degree
In terms of bachelor's degree, the demographic groups most similar to Cypriots are Immigrants from Australia (48.5%, a difference of 1.1%), Immigrants from China (48.4%, a difference of 1.3%), Immigrants from South Central Asia (48.3%, a difference of 1.5%), Immigrants from Hong Kong (48.2%, a difference of 1.7%), and Immigrants from Eastern Asia (48.1%, a difference of 1.9%).
| Demographics | Rating | Rank | Bachelor's Degree |
| Immigrants | India | 100.0 /100 | #3 | Exceptional 51.3% |
| Immigrants | Taiwan | 100.0 /100 | #4 | Exceptional 51.2% |
| Iranians | 100.0 /100 | #5 | Exceptional 51.0% |
| Okinawans | 100.0 /100 | #6 | Exceptional 50.5% |
| Immigrants | Iran | 100.0 /100 | #7 | Exceptional 50.3% |
| Thais | 100.0 /100 | #8 | Exceptional 50.1% |
| Immigrants | Israel | 100.0 /100 | #9 | Exceptional 50.0% |
| Cypriots | 100.0 /100 | #10 | Exceptional 49.0% |
| Immigrants | Australia | 100.0 /100 | #11 | Exceptional 48.5% |
| Immigrants | China | 100.0 /100 | #12 | Exceptional 48.4% |
| Immigrants | South Central Asia | 100.0 /100 | #13 | Exceptional 48.3% |
| Immigrants | Hong Kong | 100.0 /100 | #14 | Exceptional 48.2% |
| Immigrants | Eastern Asia | 100.0 /100 | #15 | Exceptional 48.1% |
| Soviet Union | 100.0 /100 | #16 | Exceptional 47.9% |
| Eastern Europeans | 100.0 /100 | #17 | Exceptional 47.5% |
Demographics Similar to Senegalese by Bachelor's Degree
In terms of bachelor's degree, the demographic groups most similar to Senegalese are Scandinavian (37.5%, a difference of 0.040%), Immigrants from Peru (37.5%, a difference of 0.080%), Immigrants from Bosnia and Herzegovina (37.6%, a difference of 0.13%), Immigrants from Senegal (37.6%, a difference of 0.16%), and Norwegian (37.5%, a difference of 0.18%).
| Demographics | Rating | Rank | Bachelor's Degree |
| Costa Ricans | 47.6 /100 | #176 | Average 37.7% |
| Basques | 47.4 /100 | #177 | Average 37.7% |
| Immigrants | Cameroon | 46.8 /100 | #178 | Average 37.7% |
| Immigrants | Colombia | 45.4 /100 | #179 | Average 37.7% |
| Irish | 44.3 /100 | #180 | Average 37.6% |
| Immigrants | Senegal | 43.8 /100 | #181 | Average 37.6% |
| Immigrants | Bosnia and Herzegovina | 43.4 /100 | #182 | Average 37.6% |
| Senegalese | 42.2 /100 | #183 | Average 37.5% |
| Scandinavians | 41.7 /100 | #184 | Average 37.5% |
| Immigrants | Peru | 41.3 /100 | #185 | Average 37.5% |
| Norwegians | 40.4 /100 | #186 | Average 37.5% |
| English | 39.7 /100 | #187 | Fair 37.4% |
| Immigrants | Oceania | 37.3 /100 | #188 | Fair 37.3% |
| Slovaks | 36.9 /100 | #189 | Fair 37.3% |
| Swiss | 34.1 /100 | #190 | Fair 37.2% |