Ecuadorian vs Immigrants from Moldova 6th Grade
COMPARE
Ecuadorian
Immigrants from Moldova
6th Grade
6th Grade Comparison
Ecuadorians
Immigrants from Moldova
95.5%
6TH GRADE
0.0/ 100
METRIC RATING
310th/ 347
METRIC RANK
97.3%
6TH GRADE
90.0/ 100
METRIC RATING
133rd/ 347
METRIC RANK
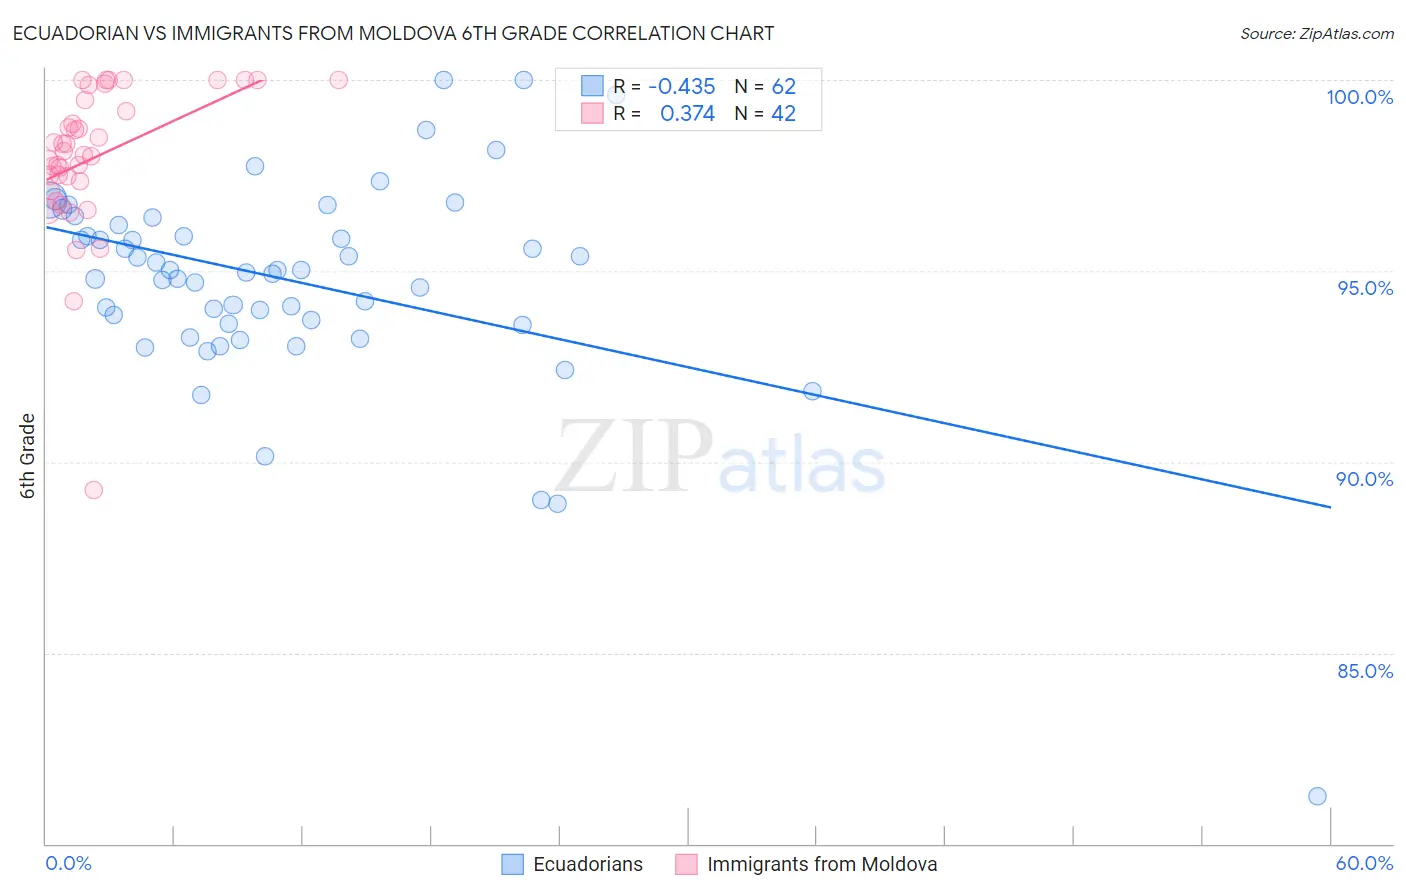
Ecuadorian vs Immigrants from Moldova 6th Grade Correlation Chart
The statistical analysis conducted on geographies consisting of 317,865,755 people shows a moderate negative correlation between the proportion of Ecuadorians and percentage of population with at least 6th grade education in the United States with a correlation coefficient (R) of -0.435 and weighted average of 95.5%. Similarly, the statistical analysis conducted on geographies consisting of 124,396,843 people shows a mild positive correlation between the proportion of Immigrants from Moldova and percentage of population with at least 6th grade education in the United States with a correlation coefficient (R) of 0.374 and weighted average of 97.3%, a difference of 1.9%.
6th Grade Correlation Summary
| Measurement | Ecuadorian | Immigrants from Moldova |
| Minimum | 81.2% | 89.3% |
| Maximum | 100.0% | 100.0% |
| Range | 18.7% | 10.7% |
| Mean | 94.7% | 98.0% |
| Median | 95.0% | 98.1% |
| Interquartile 25% (IQ1) | 93.6% | 97.3% |
| Interquartile 75% (IQ3) | 96.2% | 99.5% |
| Interquartile Range (IQR) | 2.6% | 2.2% |
| Standard Deviation (Sample) | 2.8% | 2.0% |
| Standard Deviation (Population) | 2.8% | 2.0% |
Similar Demographics by 6th Grade
Demographics Similar to Ecuadorians by 6th Grade
In terms of 6th grade, the demographic groups most similar to Ecuadorians are Puerto Rican (95.5%, a difference of 0.010%), Immigrants from Portugal (95.5%, a difference of 0.020%), Immigrants from Guyana (95.5%, a difference of 0.030%), Immigrants from Caribbean (95.6%, a difference of 0.060%), and Guyanese (95.6%, a difference of 0.070%).
| Demographics | Rating | Rank | 6th Grade |
| Bangladeshis | 0.0 /100 | #303 | Tragic 95.7% |
| Indonesians | 0.0 /100 | #304 | Tragic 95.6% |
| Immigrants | Cuba | 0.0 /100 | #305 | Tragic 95.6% |
| Immigrants | Haiti | 0.0 /100 | #306 | Tragic 95.6% |
| Guyanese | 0.0 /100 | #307 | Tragic 95.6% |
| Immigrants | Caribbean | 0.0 /100 | #308 | Tragic 95.6% |
| Puerto Ricans | 0.0 /100 | #309 | Tragic 95.5% |
| Ecuadorians | 0.0 /100 | #310 | Tragic 95.5% |
| Immigrants | Portugal | 0.0 /100 | #311 | Tragic 95.5% |
| Immigrants | Guyana | 0.0 /100 | #312 | Tragic 95.5% |
| Nicaraguans | 0.0 /100 | #313 | Tragic 95.4% |
| Immigrants | Vietnam | 0.0 /100 | #314 | Tragic 95.4% |
| Immigrants | Bangladesh | 0.0 /100 | #315 | Tragic 95.4% |
| Japanese | 0.0 /100 | #316 | Tragic 95.4% |
| Vietnamese | 0.0 /100 | #317 | Tragic 95.3% |
Demographics Similar to Immigrants from Moldova by 6th Grade
In terms of 6th grade, the demographic groups most similar to Immigrants from Moldova are Immigrants from Europe (97.3%, a difference of 0.010%), Palestinian (97.3%, a difference of 0.010%), Immigrants from Kuwait (97.3%, a difference of 0.010%), Immigrants from Hungary (97.3%, a difference of 0.010%), and Filipino (97.3%, a difference of 0.010%).
| Demographics | Rating | Rank | 6th Grade |
| Immigrants | Bulgaria | 93.6 /100 | #126 | Exceptional 97.3% |
| Immigrants | Croatia | 93.1 /100 | #127 | Exceptional 97.3% |
| Immigrants | Romania | 92.0 /100 | #128 | Exceptional 97.3% |
| Immigrants | Serbia | 91.9 /100 | #129 | Exceptional 97.3% |
| Cambodians | 91.8 /100 | #130 | Exceptional 97.3% |
| Immigrants | Europe | 91.1 /100 | #131 | Exceptional 97.3% |
| Palestinians | 90.9 /100 | #132 | Exceptional 97.3% |
| Immigrants | Moldova | 90.0 /100 | #133 | Excellent 97.3% |
| Immigrants | Kuwait | 89.5 /100 | #134 | Excellent 97.3% |
| Immigrants | Hungary | 89.5 /100 | #135 | Excellent 97.3% |
| Filipinos | 88.9 /100 | #136 | Excellent 97.3% |
| Burmese | 87.8 /100 | #137 | Excellent 97.3% |
| Blackfeet | 87.7 /100 | #138 | Excellent 97.3% |
| Immigrants | Turkey | 86.1 /100 | #139 | Excellent 97.3% |
| Immigrants | North Macedonia | 85.5 /100 | #140 | Excellent 97.2% |