Ecuadorian vs Liberian 6th Grade
COMPARE
Ecuadorian
Liberian
6th Grade
6th Grade Comparison
Ecuadorians
Liberians
95.5%
6TH GRADE
0.0/ 100
METRIC RATING
310th/ 347
METRIC RANK
96.8%
6TH GRADE
7.5/ 100
METRIC RATING
217th/ 347
METRIC RANK
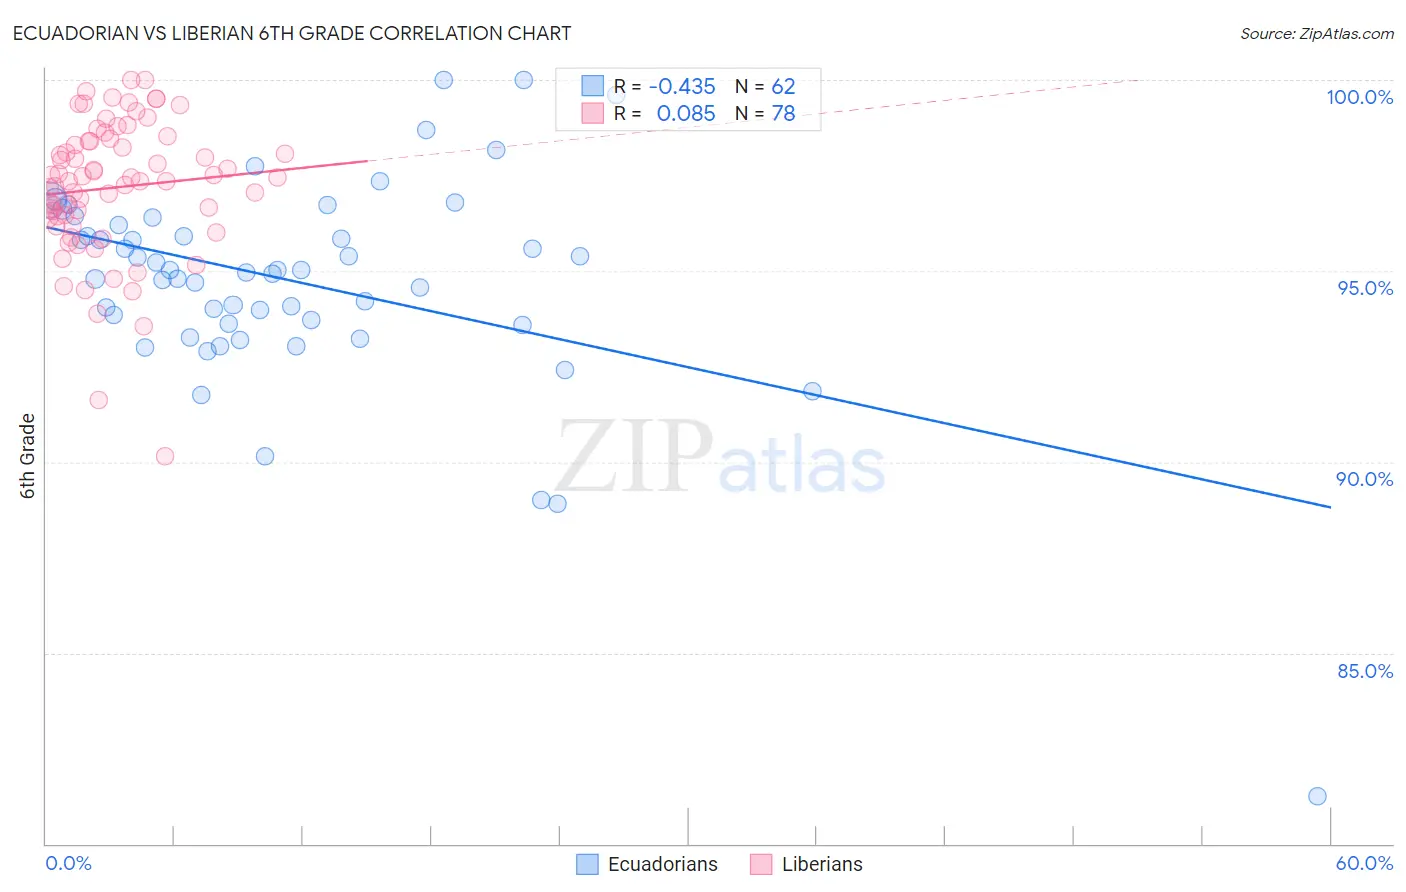
Ecuadorian vs Liberian 6th Grade Correlation Chart
The statistical analysis conducted on geographies consisting of 317,865,755 people shows a moderate negative correlation between the proportion of Ecuadorians and percentage of population with at least 6th grade education in the United States with a correlation coefficient (R) of -0.435 and weighted average of 95.5%. Similarly, the statistical analysis conducted on geographies consisting of 118,098,536 people shows a slight positive correlation between the proportion of Liberians and percentage of population with at least 6th grade education in the United States with a correlation coefficient (R) of 0.085 and weighted average of 96.8%, a difference of 1.3%.
6th Grade Correlation Summary
| Measurement | Ecuadorian | Liberian |
| Minimum | 81.2% | 90.1% |
| Maximum | 100.0% | 100.0% |
| Range | 18.7% | 9.9% |
| Mean | 94.7% | 97.2% |
| Median | 95.0% | 97.4% |
| Interquartile 25% (IQ1) | 93.6% | 96.4% |
| Interquartile 75% (IQ3) | 96.2% | 98.4% |
| Interquartile Range (IQR) | 2.6% | 2.0% |
| Standard Deviation (Sample) | 2.8% | 1.8% |
| Standard Deviation (Population) | 2.8% | 1.8% |
Similar Demographics by 6th Grade
Demographics Similar to Ecuadorians by 6th Grade
In terms of 6th grade, the demographic groups most similar to Ecuadorians are Puerto Rican (95.5%, a difference of 0.010%), Immigrants from Portugal (95.5%, a difference of 0.020%), Immigrants from Guyana (95.5%, a difference of 0.030%), Immigrants from Caribbean (95.6%, a difference of 0.060%), and Guyanese (95.6%, a difference of 0.070%).
| Demographics | Rating | Rank | 6th Grade |
| Bangladeshis | 0.0 /100 | #303 | Tragic 95.7% |
| Indonesians | 0.0 /100 | #304 | Tragic 95.6% |
| Immigrants | Cuba | 0.0 /100 | #305 | Tragic 95.6% |
| Immigrants | Haiti | 0.0 /100 | #306 | Tragic 95.6% |
| Guyanese | 0.0 /100 | #307 | Tragic 95.6% |
| Immigrants | Caribbean | 0.0 /100 | #308 | Tragic 95.6% |
| Puerto Ricans | 0.0 /100 | #309 | Tragic 95.5% |
| Ecuadorians | 0.0 /100 | #310 | Tragic 95.5% |
| Immigrants | Portugal | 0.0 /100 | #311 | Tragic 95.5% |
| Immigrants | Guyana | 0.0 /100 | #312 | Tragic 95.5% |
| Nicaraguans | 0.0 /100 | #313 | Tragic 95.4% |
| Immigrants | Vietnam | 0.0 /100 | #314 | Tragic 95.4% |
| Immigrants | Bangladesh | 0.0 /100 | #315 | Tragic 95.4% |
| Japanese | 0.0 /100 | #316 | Tragic 95.4% |
| Vietnamese | 0.0 /100 | #317 | Tragic 95.3% |
Demographics Similar to Liberians by 6th Grade
In terms of 6th grade, the demographic groups most similar to Liberians are Navajo (96.8%, a difference of 0.0%), Portuguese (96.8%, a difference of 0.010%), Sierra Leonean (96.8%, a difference of 0.010%), Paiute (96.8%, a difference of 0.010%), and Costa Rican (96.8%, a difference of 0.010%).
| Demographics | Rating | Rank | 6th Grade |
| Immigrants | Nepal | 10.1 /100 | #210 | Poor 96.8% |
| Immigrants | Iraq | 9.2 /100 | #211 | Tragic 96.8% |
| Moroccans | 9.0 /100 | #212 | Tragic 96.8% |
| Immigrants | Sudan | 8.7 /100 | #213 | Tragic 96.8% |
| Portuguese | 8.2 /100 | #214 | Tragic 96.8% |
| Sierra Leoneans | 8.0 /100 | #215 | Tragic 96.8% |
| Paiute | 7.8 /100 | #216 | Tragic 96.8% |
| Liberians | 7.5 /100 | #217 | Tragic 96.8% |
| Navajo | 7.3 /100 | #218 | Tragic 96.8% |
| Costa Ricans | 6.8 /100 | #219 | Tragic 96.8% |
| Immigrants | Morocco | 6.2 /100 | #220 | Tragic 96.7% |
| Tongans | 6.1 /100 | #221 | Tragic 96.7% |
| Immigrants | Syria | 5.9 /100 | #222 | Tragic 96.7% |
| Bahamians | 4.8 /100 | #223 | Tragic 96.7% |
| Immigrants | Southern Europe | 4.4 /100 | #224 | Tragic 96.7% |