Ecuadorian vs New Zealander 6th Grade
COMPARE
Ecuadorian
New Zealander
6th Grade
6th Grade Comparison
Ecuadorians
New Zealanders
95.5%
6TH GRADE
0.0/ 100
METRIC RATING
310th/ 347
METRIC RANK
97.7%
6TH GRADE
99.6/ 100
METRIC RATING
66th/ 347
METRIC RANK
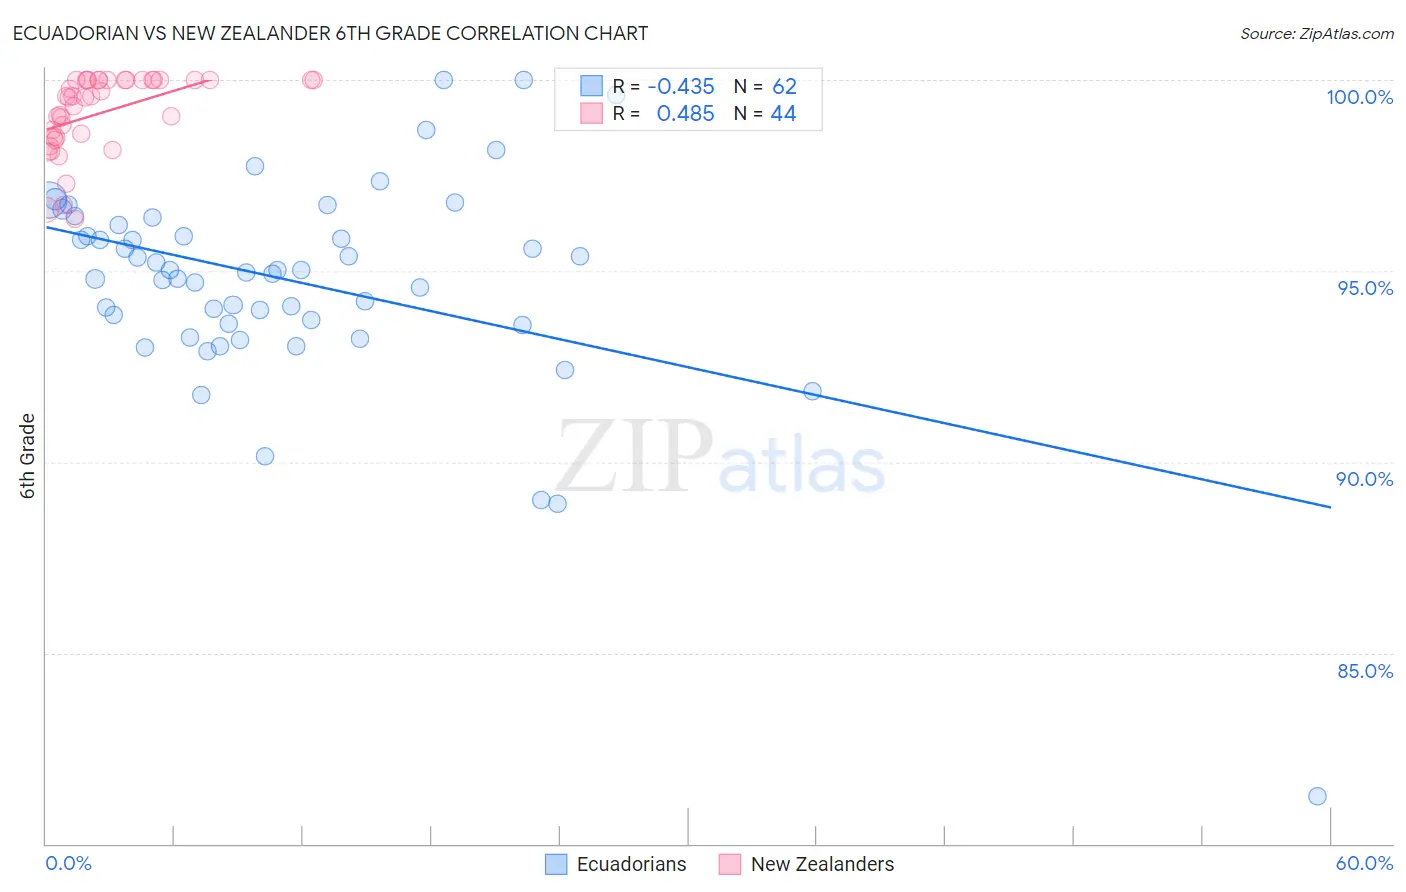
Ecuadorian vs New Zealander 6th Grade Correlation Chart
The statistical analysis conducted on geographies consisting of 317,865,755 people shows a moderate negative correlation between the proportion of Ecuadorians and percentage of population with at least 6th grade education in the United States with a correlation coefficient (R) of -0.435 and weighted average of 95.5%. Similarly, the statistical analysis conducted on geographies consisting of 106,912,544 people shows a moderate positive correlation between the proportion of New Zealanders and percentage of population with at least 6th grade education in the United States with a correlation coefficient (R) of 0.485 and weighted average of 97.7%, a difference of 2.3%.
6th Grade Correlation Summary
| Measurement | Ecuadorian | New Zealander |
| Minimum | 81.2% | 96.4% |
| Maximum | 100.0% | 100.0% |
| Range | 18.7% | 3.6% |
| Mean | 94.7% | 99.1% |
| Median | 95.0% | 99.6% |
| Interquartile 25% (IQ1) | 93.6% | 98.5% |
| Interquartile 75% (IQ3) | 96.2% | 100.0% |
| Interquartile Range (IQR) | 2.6% | 1.5% |
| Standard Deviation (Sample) | 2.8% | 1.0% |
| Standard Deviation (Population) | 2.8% | 1.0% |
Similar Demographics by 6th Grade
Demographics Similar to Ecuadorians by 6th Grade
In terms of 6th grade, the demographic groups most similar to Ecuadorians are Puerto Rican (95.5%, a difference of 0.010%), Immigrants from Portugal (95.5%, a difference of 0.020%), Immigrants from Guyana (95.5%, a difference of 0.030%), Immigrants from Caribbean (95.6%, a difference of 0.060%), and Guyanese (95.6%, a difference of 0.070%).
| Demographics | Rating | Rank | 6th Grade |
| Bangladeshis | 0.0 /100 | #303 | Tragic 95.7% |
| Indonesians | 0.0 /100 | #304 | Tragic 95.6% |
| Immigrants | Cuba | 0.0 /100 | #305 | Tragic 95.6% |
| Immigrants | Haiti | 0.0 /100 | #306 | Tragic 95.6% |
| Guyanese | 0.0 /100 | #307 | Tragic 95.6% |
| Immigrants | Caribbean | 0.0 /100 | #308 | Tragic 95.6% |
| Puerto Ricans | 0.0 /100 | #309 | Tragic 95.5% |
| Ecuadorians | 0.0 /100 | #310 | Tragic 95.5% |
| Immigrants | Portugal | 0.0 /100 | #311 | Tragic 95.5% |
| Immigrants | Guyana | 0.0 /100 | #312 | Tragic 95.5% |
| Nicaraguans | 0.0 /100 | #313 | Tragic 95.4% |
| Immigrants | Vietnam | 0.0 /100 | #314 | Tragic 95.4% |
| Immigrants | Bangladesh | 0.0 /100 | #315 | Tragic 95.4% |
| Japanese | 0.0 /100 | #316 | Tragic 95.4% |
| Vietnamese | 0.0 /100 | #317 | Tragic 95.3% |
Demographics Similar to New Zealanders by 6th Grade
In terms of 6th grade, the demographic groups most similar to New Zealanders are Immigrants from Northern Europe (97.7%, a difference of 0.0%), Kiowa (97.7%, a difference of 0.0%), Immigrants from Austria (97.7%, a difference of 0.0%), Canadian (97.7%, a difference of 0.010%), and Russian (97.7%, a difference of 0.020%).
| Demographics | Rating | Rank | 6th Grade |
| Americans | 99.8 /100 | #59 | Exceptional 97.7% |
| Immigrants | Canada | 99.8 /100 | #60 | Exceptional 97.7% |
| Serbians | 99.7 /100 | #61 | Exceptional 97.7% |
| Immigrants | North America | 99.7 /100 | #62 | Exceptional 97.7% |
| Russians | 99.7 /100 | #63 | Exceptional 97.7% |
| Canadians | 99.7 /100 | #64 | Exceptional 97.7% |
| Immigrants | Northern Europe | 99.6 /100 | #65 | Exceptional 97.7% |
| New Zealanders | 99.6 /100 | #66 | Exceptional 97.7% |
| Kiowa | 99.6 /100 | #67 | Exceptional 97.7% |
| Immigrants | Austria | 99.6 /100 | #68 | Exceptional 97.7% |
| Iranians | 99.6 /100 | #69 | Exceptional 97.6% |
| Cajuns | 99.5 /100 | #70 | Exceptional 97.6% |
| Chickasaw | 99.5 /100 | #71 | Exceptional 97.6% |
| Macedonians | 99.4 /100 | #72 | Exceptional 97.6% |
| Cherokee | 99.4 /100 | #73 | Exceptional 97.6% |