Ecuadorian vs Lithuanian 6th Grade
COMPARE
Ecuadorian
Lithuanian
6th Grade
6th Grade Comparison
Ecuadorians
Lithuanians
95.5%
6TH GRADE
0.0/ 100
METRIC RATING
310th/ 347
METRIC RANK
98.1%
6TH GRADE
100.0/ 100
METRIC RATING
21st/ 347
METRIC RANK
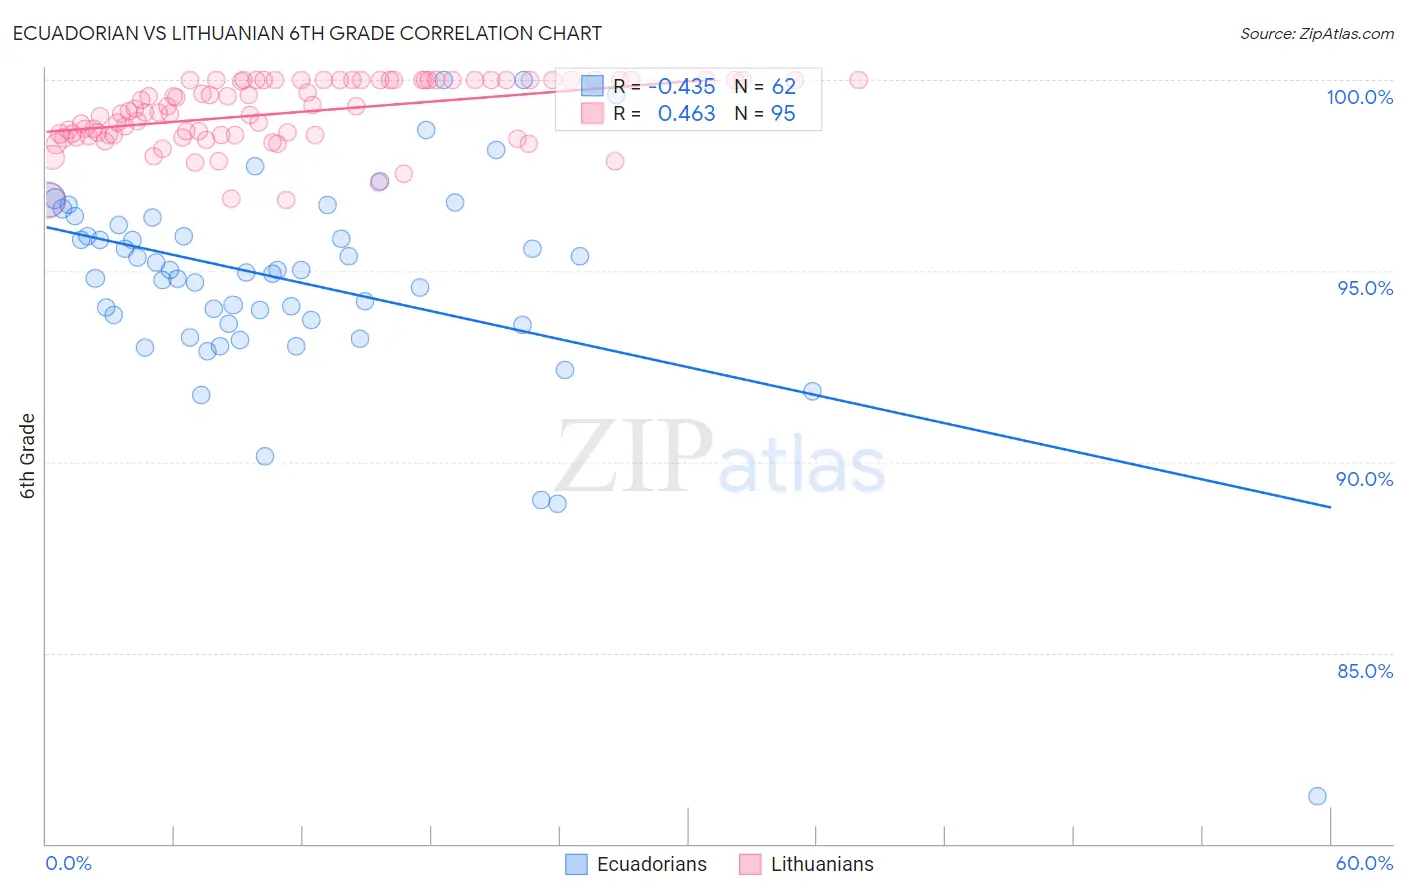
Ecuadorian vs Lithuanian 6th Grade Correlation Chart
The statistical analysis conducted on geographies consisting of 317,865,755 people shows a moderate negative correlation between the proportion of Ecuadorians and percentage of population with at least 6th grade education in the United States with a correlation coefficient (R) of -0.435 and weighted average of 95.5%. Similarly, the statistical analysis conducted on geographies consisting of 421,945,620 people shows a moderate positive correlation between the proportion of Lithuanians and percentage of population with at least 6th grade education in the United States with a correlation coefficient (R) of 0.463 and weighted average of 98.1%, a difference of 2.7%.
6th Grade Correlation Summary
| Measurement | Ecuadorian | Lithuanian |
| Minimum | 81.2% | 96.9% |
| Maximum | 100.0% | 100.0% |
| Range | 18.7% | 3.1% |
| Mean | 94.7% | 99.1% |
| Median | 95.0% | 99.2% |
| Interquartile 25% (IQ1) | 93.6% | 98.6% |
| Interquartile 75% (IQ3) | 96.2% | 100.0% |
| Interquartile Range (IQR) | 2.6% | 1.4% |
| Standard Deviation (Sample) | 2.8% | 0.84% |
| Standard Deviation (Population) | 2.8% | 0.84% |
Similar Demographics by 6th Grade
Demographics Similar to Ecuadorians by 6th Grade
In terms of 6th grade, the demographic groups most similar to Ecuadorians are Puerto Rican (95.5%, a difference of 0.010%), Immigrants from Portugal (95.5%, a difference of 0.020%), Immigrants from Guyana (95.5%, a difference of 0.030%), Immigrants from Caribbean (95.6%, a difference of 0.060%), and Guyanese (95.6%, a difference of 0.070%).
| Demographics | Rating | Rank | 6th Grade |
| Bangladeshis | 0.0 /100 | #303 | Tragic 95.7% |
| Indonesians | 0.0 /100 | #304 | Tragic 95.6% |
| Immigrants | Cuba | 0.0 /100 | #305 | Tragic 95.6% |
| Immigrants | Haiti | 0.0 /100 | #306 | Tragic 95.6% |
| Guyanese | 0.0 /100 | #307 | Tragic 95.6% |
| Immigrants | Caribbean | 0.0 /100 | #308 | Tragic 95.6% |
| Puerto Ricans | 0.0 /100 | #309 | Tragic 95.5% |
| Ecuadorians | 0.0 /100 | #310 | Tragic 95.5% |
| Immigrants | Portugal | 0.0 /100 | #311 | Tragic 95.5% |
| Immigrants | Guyana | 0.0 /100 | #312 | Tragic 95.5% |
| Nicaraguans | 0.0 /100 | #313 | Tragic 95.4% |
| Immigrants | Vietnam | 0.0 /100 | #314 | Tragic 95.4% |
| Immigrants | Bangladesh | 0.0 /100 | #315 | Tragic 95.4% |
| Japanese | 0.0 /100 | #316 | Tragic 95.4% |
| Vietnamese | 0.0 /100 | #317 | Tragic 95.3% |
Demographics Similar to Lithuanians by 6th Grade
In terms of 6th grade, the demographic groups most similar to Lithuanians are Finnish (98.1%, a difference of 0.010%), Danish (98.0%, a difference of 0.020%), Polish (98.1%, a difference of 0.030%), Pennsylvania German (98.1%, a difference of 0.030%), and Irish (98.1%, a difference of 0.030%).
| Demographics | Rating | Rank | 6th Grade |
| Carpatho Rusyns | 100.0 /100 | #14 | Exceptional 98.1% |
| Inupiat | 100.0 /100 | #15 | Exceptional 98.1% |
| Scottish | 100.0 /100 | #16 | Exceptional 98.1% |
| Poles | 100.0 /100 | #17 | Exceptional 98.1% |
| Pennsylvania Germans | 100.0 /100 | #18 | Exceptional 98.1% |
| Irish | 100.0 /100 | #19 | Exceptional 98.1% |
| Finns | 100.0 /100 | #20 | Exceptional 98.1% |
| Lithuanians | 100.0 /100 | #21 | Exceptional 98.1% |
| Danes | 100.0 /100 | #22 | Exceptional 98.0% |
| Sioux | 100.0 /100 | #23 | Exceptional 98.0% |
| Croatians | 100.0 /100 | #24 | Exceptional 98.0% |
| Scotch-Irish | 100.0 /100 | #25 | Exceptional 98.0% |
| Czechs | 100.0 /100 | #26 | Exceptional 98.0% |
| Yup'ik | 100.0 /100 | #27 | Exceptional 98.0% |
| Scandinavians | 100.0 /100 | #28 | Exceptional 98.0% |