Nonimmigrants vs Immigrants from Hong Kong 6th Grade
COMPARE
Nonimmigrants
Immigrants from Hong Kong
6th Grade
6th Grade Comparison
Nonimmigrants
Immigrants from Hong Kong
97.4%
6TH GRADE
97.3/ 100
METRIC RATING
108th/ 347
METRIC RANK
96.3%
6TH GRADE
0.2/ 100
METRIC RATING
271st/ 347
METRIC RANK
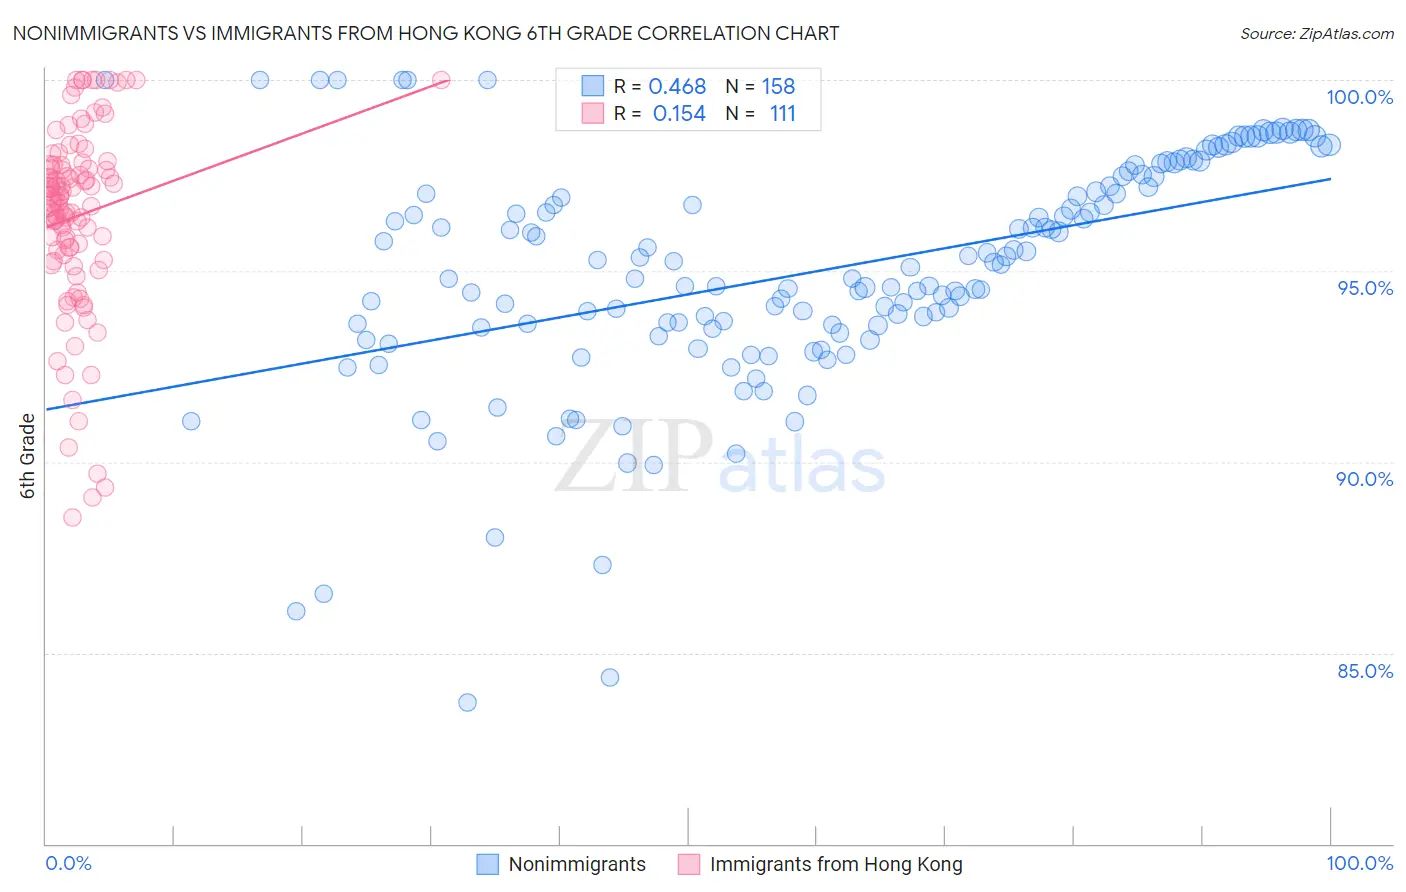
Nonimmigrants vs Immigrants from Hong Kong 6th Grade Correlation Chart
The statistical analysis conducted on geographies consisting of 585,374,489 people shows a moderate positive correlation between the proportion of Nonimmigrants and percentage of population with at least 6th grade education in the United States with a correlation coefficient (R) of 0.468 and weighted average of 97.4%. Similarly, the statistical analysis conducted on geographies consisting of 253,909,193 people shows a poor positive correlation between the proportion of Immigrants from Hong Kong and percentage of population with at least 6th grade education in the United States with a correlation coefficient (R) of 0.154 and weighted average of 96.3%, a difference of 1.2%.
6th Grade Correlation Summary
| Measurement | Nonimmigrants | Immigrants from Hong Kong |
| Minimum | 83.7% | 88.6% |
| Maximum | 100.0% | 100.0% |
| Range | 16.3% | 11.4% |
| Mean | 95.0% | 96.4% |
| Median | 95.1% | 96.9% |
| Interquartile 25% (IQ1) | 93.5% | 95.4% |
| Interquartile 75% (IQ3) | 97.2% | 97.8% |
| Interquartile Range (IQR) | 3.7% | 2.4% |
| Standard Deviation (Sample) | 3.0% | 2.5% |
| Standard Deviation (Population) | 3.0% | 2.5% |
Similar Demographics by 6th Grade
Demographics Similar to Nonimmigrants by 6th Grade
In terms of 6th grade, the demographic groups most similar to Nonimmigrants are Immigrants from Czechoslovakia (97.4%, a difference of 0.0%), Immigrants from Singapore (97.5%, a difference of 0.010%), Menominee (97.5%, a difference of 0.020%), Thai (97.4%, a difference of 0.020%), and Iroquois (97.4%, a difference of 0.020%).
| Demographics | Rating | Rank | 6th Grade |
| South Africans | 98.2 /100 | #101 | Exceptional 97.5% |
| Choctaw | 98.0 /100 | #102 | Exceptional 97.5% |
| Bhutanese | 98.0 /100 | #103 | Exceptional 97.5% |
| German Russians | 97.9 /100 | #104 | Exceptional 97.5% |
| Cheyenne | 97.9 /100 | #105 | Exceptional 97.5% |
| Menominee | 97.7 /100 | #106 | Exceptional 97.5% |
| Immigrants | Singapore | 97.6 /100 | #107 | Exceptional 97.5% |
| Immigrants | Nonimmigrants | 97.3 /100 | #108 | Exceptional 97.4% |
| Immigrants | Czechoslovakia | 97.3 /100 | #109 | Exceptional 97.4% |
| Thais | 96.9 /100 | #110 | Exceptional 97.4% |
| Iroquois | 96.9 /100 | #111 | Exceptional 97.4% |
| Immigrants | Latvia | 96.7 /100 | #112 | Exceptional 97.4% |
| Immigrants | Saudi Arabia | 96.5 /100 | #113 | Exceptional 97.4% |
| Colville | 96.4 /100 | #114 | Exceptional 97.4% |
| Immigrants | Switzerland | 95.7 /100 | #115 | Exceptional 97.4% |
Demographics Similar to Immigrants from Hong Kong by 6th Grade
In terms of 6th grade, the demographic groups most similar to Immigrants from Hong Kong are Immigrants from Uzbekistan (96.3%, a difference of 0.010%), West Indian (96.3%, a difference of 0.010%), Immigrants from South America (96.3%, a difference of 0.010%), Immigrants from Bolivia (96.3%, a difference of 0.030%), and Ghanaian (96.4%, a difference of 0.040%).
| Demographics | Rating | Rank | 6th Grade |
| Armenians | 0.3 /100 | #264 | Tragic 96.4% |
| Immigrants | Jamaica | 0.2 /100 | #265 | Tragic 96.4% |
| Ghanaians | 0.2 /100 | #266 | Tragic 96.4% |
| Afghans | 0.2 /100 | #267 | Tragic 96.4% |
| Immigrants | Uzbekistan | 0.2 /100 | #268 | Tragic 96.3% |
| West Indians | 0.2 /100 | #269 | Tragic 96.3% |
| Immigrants | South America | 0.2 /100 | #270 | Tragic 96.3% |
| Immigrants | Hong Kong | 0.2 /100 | #271 | Tragic 96.3% |
| Immigrants | Bolivia | 0.1 /100 | #272 | Tragic 96.3% |
| Immigrants | Cameroon | 0.1 /100 | #273 | Tragic 96.3% |
| Immigrants | Philippines | 0.1 /100 | #274 | Tragic 96.3% |
| Immigrants | Ghana | 0.1 /100 | #275 | Tragic 96.3% |
| Yaqui | 0.1 /100 | #276 | Tragic 96.3% |
| Immigrants | Western Africa | 0.1 /100 | #277 | Tragic 96.3% |
| Immigrants | Thailand | 0.1 /100 | #278 | Tragic 96.3% |