Paiute vs Immigrants from Hong Kong 6th Grade
COMPARE
Paiute
Immigrants from Hong Kong
6th Grade
6th Grade Comparison
Paiute
Immigrants from Hong Kong
96.8%
6TH GRADE
7.8/ 100
METRIC RATING
216th/ 347
METRIC RANK
96.3%
6TH GRADE
0.2/ 100
METRIC RATING
271st/ 347
METRIC RANK
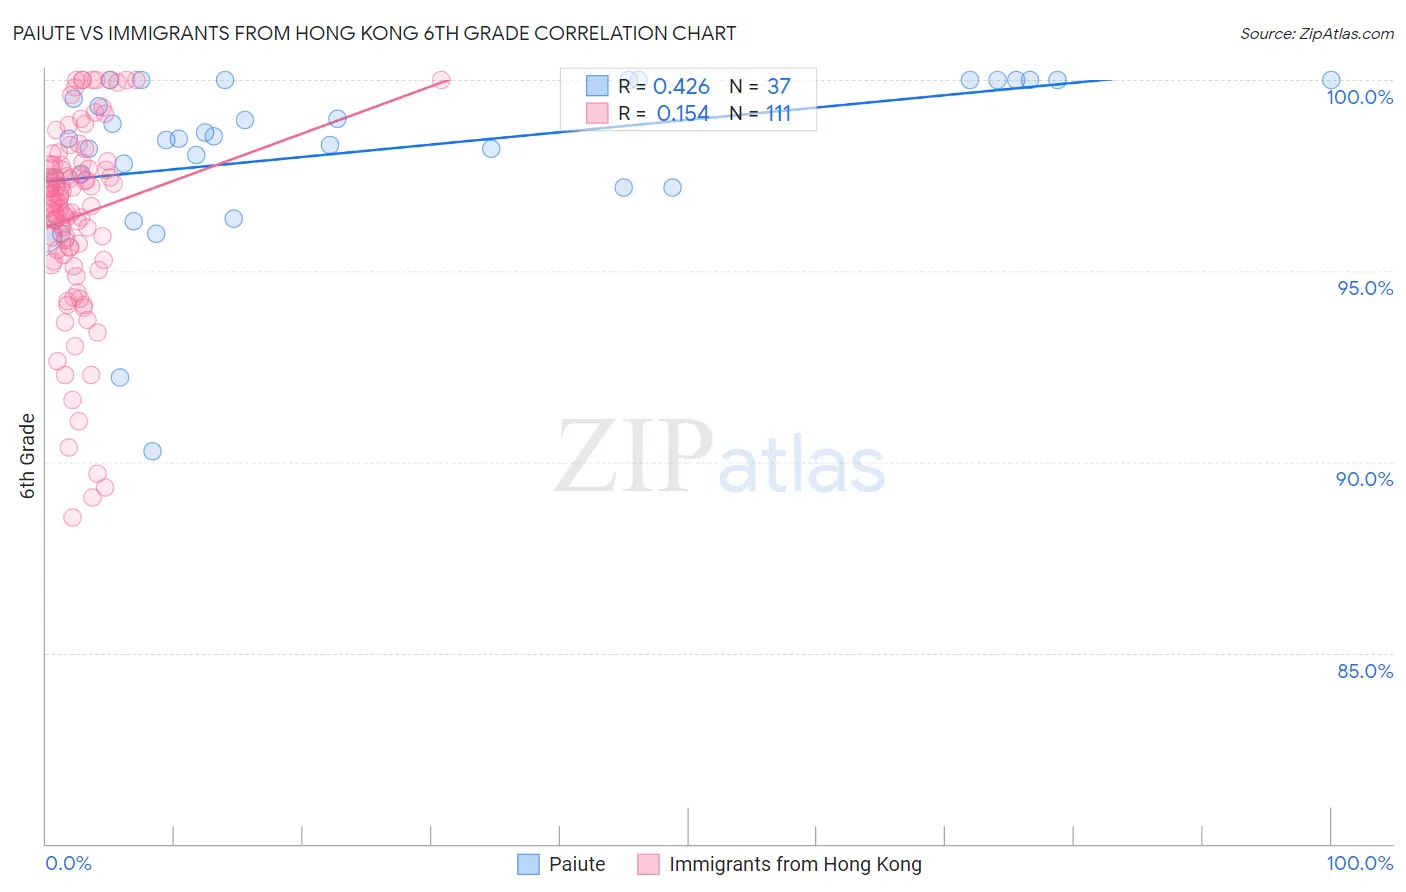
Paiute vs Immigrants from Hong Kong 6th Grade Correlation Chart
The statistical analysis conducted on geographies consisting of 58,402,332 people shows a moderate positive correlation between the proportion of Paiute and percentage of population with at least 6th grade education in the United States with a correlation coefficient (R) of 0.426 and weighted average of 96.8%. Similarly, the statistical analysis conducted on geographies consisting of 253,909,193 people shows a poor positive correlation between the proportion of Immigrants from Hong Kong and percentage of population with at least 6th grade education in the United States with a correlation coefficient (R) of 0.154 and weighted average of 96.3%, a difference of 0.46%.
6th Grade Correlation Summary
| Measurement | Paiute | Immigrants from Hong Kong |
| Minimum | 90.3% | 88.6% |
| Maximum | 100.0% | 100.0% |
| Range | 9.7% | 11.4% |
| Mean | 98.1% | 96.4% |
| Median | 98.5% | 96.9% |
| Interquartile 25% (IQ1) | 97.3% | 95.4% |
| Interquartile 75% (IQ3) | 100.0% | 97.8% |
| Interquartile Range (IQR) | 2.7% | 2.4% |
| Standard Deviation (Sample) | 2.1% | 2.5% |
| Standard Deviation (Population) | 2.1% | 2.5% |
Similar Demographics by 6th Grade
Demographics Similar to Paiute by 6th Grade
In terms of 6th grade, the demographic groups most similar to Paiute are Sierra Leonean (96.8%, a difference of 0.0%), Immigrants from Sudan (96.8%, a difference of 0.010%), Portuguese (96.8%, a difference of 0.010%), Liberian (96.8%, a difference of 0.010%), and Navajo (96.8%, a difference of 0.010%).
| Demographics | Rating | Rank | 6th Grade |
| Immigrants | Oceania | 11.0 /100 | #209 | Poor 96.8% |
| Immigrants | Nepal | 10.1 /100 | #210 | Poor 96.8% |
| Immigrants | Iraq | 9.2 /100 | #211 | Tragic 96.8% |
| Moroccans | 9.0 /100 | #212 | Tragic 96.8% |
| Immigrants | Sudan | 8.7 /100 | #213 | Tragic 96.8% |
| Portuguese | 8.2 /100 | #214 | Tragic 96.8% |
| Sierra Leoneans | 8.0 /100 | #215 | Tragic 96.8% |
| Paiute | 7.8 /100 | #216 | Tragic 96.8% |
| Liberians | 7.5 /100 | #217 | Tragic 96.8% |
| Navajo | 7.3 /100 | #218 | Tragic 96.8% |
| Costa Ricans | 6.8 /100 | #219 | Tragic 96.8% |
| Immigrants | Morocco | 6.2 /100 | #220 | Tragic 96.7% |
| Tongans | 6.1 /100 | #221 | Tragic 96.7% |
| Immigrants | Syria | 5.9 /100 | #222 | Tragic 96.7% |
| Bahamians | 4.8 /100 | #223 | Tragic 96.7% |
Demographics Similar to Immigrants from Hong Kong by 6th Grade
In terms of 6th grade, the demographic groups most similar to Immigrants from Hong Kong are Immigrants from Uzbekistan (96.3%, a difference of 0.010%), West Indian (96.3%, a difference of 0.010%), Immigrants from South America (96.3%, a difference of 0.010%), Immigrants from Bolivia (96.3%, a difference of 0.030%), and Ghanaian (96.4%, a difference of 0.040%).
| Demographics | Rating | Rank | 6th Grade |
| Armenians | 0.3 /100 | #264 | Tragic 96.4% |
| Immigrants | Jamaica | 0.2 /100 | #265 | Tragic 96.4% |
| Ghanaians | 0.2 /100 | #266 | Tragic 96.4% |
| Afghans | 0.2 /100 | #267 | Tragic 96.4% |
| Immigrants | Uzbekistan | 0.2 /100 | #268 | Tragic 96.3% |
| West Indians | 0.2 /100 | #269 | Tragic 96.3% |
| Immigrants | South America | 0.2 /100 | #270 | Tragic 96.3% |
| Immigrants | Hong Kong | 0.2 /100 | #271 | Tragic 96.3% |
| Immigrants | Bolivia | 0.1 /100 | #272 | Tragic 96.3% |
| Immigrants | Cameroon | 0.1 /100 | #273 | Tragic 96.3% |
| Immigrants | Philippines | 0.1 /100 | #274 | Tragic 96.3% |
| Immigrants | Ghana | 0.1 /100 | #275 | Tragic 96.3% |
| Yaqui | 0.1 /100 | #276 | Tragic 96.3% |
| Immigrants | Western Africa | 0.1 /100 | #277 | Tragic 96.3% |
| Immigrants | Thailand | 0.1 /100 | #278 | Tragic 96.3% |