Ecuadorian vs Choctaw No Schooling Completed
COMPARE
Ecuadorian
Choctaw
No Schooling Completed
No Schooling Completed Comparison
Ecuadorians
Choctaw
3.0%
NO SCHOOLING COMPLETED
0.0/ 100
METRIC RATING
305th/ 347
METRIC RANK
1.8%
NO SCHOOLING COMPLETED
98.1/ 100
METRIC RATING
99th/ 347
METRIC RANK
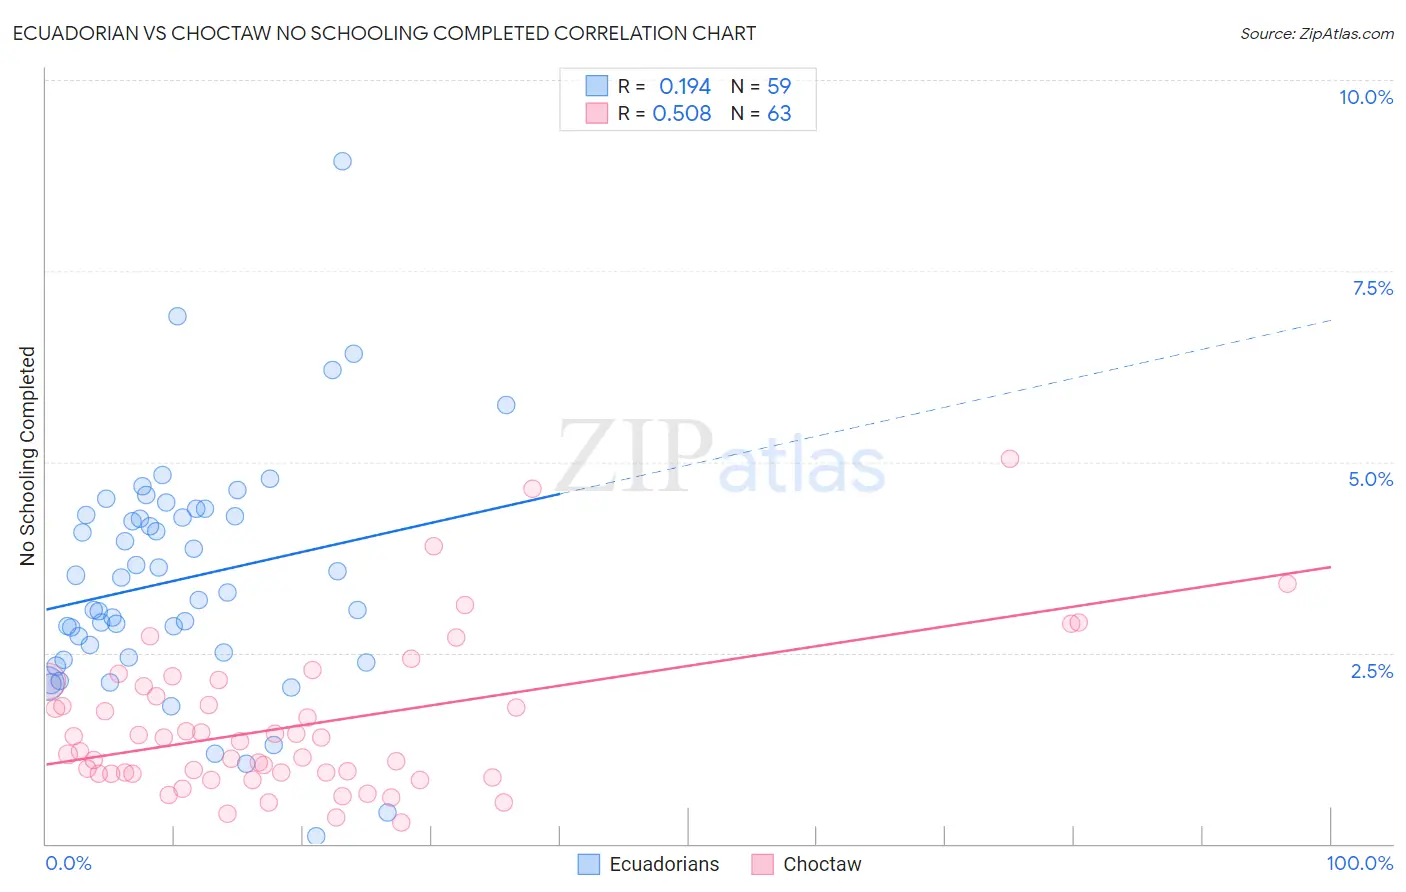
Ecuadorian vs Choctaw No Schooling Completed Correlation Chart
The statistical analysis conducted on geographies consisting of 315,790,309 people shows a poor positive correlation between the proportion of Ecuadorians and percentage of population with no schooling in the United States with a correlation coefficient (R) of 0.194 and weighted average of 3.0%. Similarly, the statistical analysis conducted on geographies consisting of 267,452,860 people shows a substantial positive correlation between the proportion of Choctaw and percentage of population with no schooling in the United States with a correlation coefficient (R) of 0.508 and weighted average of 1.8%, a difference of 63.0%.
No Schooling Completed Correlation Summary
| Measurement | Ecuadorian | Choctaw |
| Minimum | 0.10% | 0.27% |
| Maximum | 8.9% | 5.0% |
| Range | 8.8% | 4.8% |
| Mean | 3.5% | 1.6% |
| Median | 3.3% | 1.3% |
| Interquartile 25% (IQ1) | 2.4% | 0.92% |
| Interquartile 75% (IQ3) | 4.3% | 2.1% |
| Interquartile Range (IQR) | 1.9% | 1.1% |
| Standard Deviation (Sample) | 1.5% | 0.99% |
| Standard Deviation (Population) | 1.5% | 0.98% |
Similar Demographics by No Schooling Completed
Demographics Similar to Ecuadorians by No Schooling Completed
In terms of no schooling completed, the demographic groups most similar to Ecuadorians are Nicaraguan (2.9%, a difference of 0.47%), Somali (2.9%, a difference of 0.66%), Immigrants from Caribbean (2.9%, a difference of 1.7%), Belizean (3.0%, a difference of 1.7%), and Immigrants from Haiti (3.0%, a difference of 1.7%).
| Demographics | Rating | Rank | No Schooling Completed |
| Immigrants | Dominica | 0.0 /100 | #298 | Tragic 2.8% |
| Central American Indians | 0.0 /100 | #299 | Tragic 2.8% |
| Haitians | 0.0 /100 | #300 | Tragic 2.9% |
| Immigrants | South Eastern Asia | 0.0 /100 | #301 | Tragic 2.9% |
| Immigrants | Caribbean | 0.0 /100 | #302 | Tragic 2.9% |
| Somalis | 0.0 /100 | #303 | Tragic 2.9% |
| Nicaraguans | 0.0 /100 | #304 | Tragic 2.9% |
| Ecuadorians | 0.0 /100 | #305 | Tragic 3.0% |
| Belizeans | 0.0 /100 | #306 | Tragic 3.0% |
| Immigrants | Haiti | 0.0 /100 | #307 | Tragic 3.0% |
| Immigrants | Somalia | 0.0 /100 | #308 | Tragic 3.0% |
| Hispanics or Latinos | 0.0 /100 | #309 | Tragic 3.0% |
| Guyanese | 0.0 /100 | #310 | Tragic 3.0% |
| Immigrants | Azores | 0.0 /100 | #311 | Tragic 3.0% |
| Sri Lankans | 0.0 /100 | #312 | Tragic 3.0% |
Demographics Similar to Choctaw by No Schooling Completed
In terms of no schooling completed, the demographic groups most similar to Choctaw are Iranian (1.8%, a difference of 0.19%), Immigrants from Singapore (1.8%, a difference of 0.20%), Immigrants from Ireland (1.8%, a difference of 0.47%), Immigrants from Czechoslovakia (1.8%, a difference of 0.49%), and Immigrants from Switzerland (1.8%, a difference of 0.50%).
| Demographics | Rating | Rank | No Schooling Completed |
| Romanians | 98.8 /100 | #92 | Exceptional 1.8% |
| Turks | 98.7 /100 | #93 | Exceptional 1.8% |
| Immigrants | Nonimmigrants | 98.5 /100 | #94 | Exceptional 1.8% |
| Puget Sound Salish | 98.5 /100 | #95 | Exceptional 1.8% |
| Bhutanese | 98.4 /100 | #96 | Exceptional 1.8% |
| Immigrants | Ireland | 98.4 /100 | #97 | Exceptional 1.8% |
| Iranians | 98.2 /100 | #98 | Exceptional 1.8% |
| Choctaw | 98.1 /100 | #99 | Exceptional 1.8% |
| Immigrants | Singapore | 98.0 /100 | #100 | Exceptional 1.8% |
| Immigrants | Czechoslovakia | 97.9 /100 | #101 | Exceptional 1.8% |
| Immigrants | Switzerland | 97.9 /100 | #102 | Exceptional 1.8% |
| Basques | 97.9 /100 | #103 | Exceptional 1.8% |
| Thais | 97.5 /100 | #104 | Exceptional 1.8% |
| German Russians | 97.5 /100 | #105 | Exceptional 1.8% |
| Immigrants | France | 97.3 /100 | #106 | Exceptional 1.8% |