Ecuadorian vs Aleut College, 1 year or more
COMPARE
Ecuadorian
Aleut
College, 1 year or more
College, 1 year or more Comparison
Ecuadorians
Aleuts
54.3%
COLLEGE, 1 YEAR OR MORE
0.2/ 100
METRIC RATING
277th/ 347
METRIC RANK
55.4%
COLLEGE, 1 YEAR OR MORE
0.6/ 100
METRIC RATING
252nd/ 347
METRIC RANK
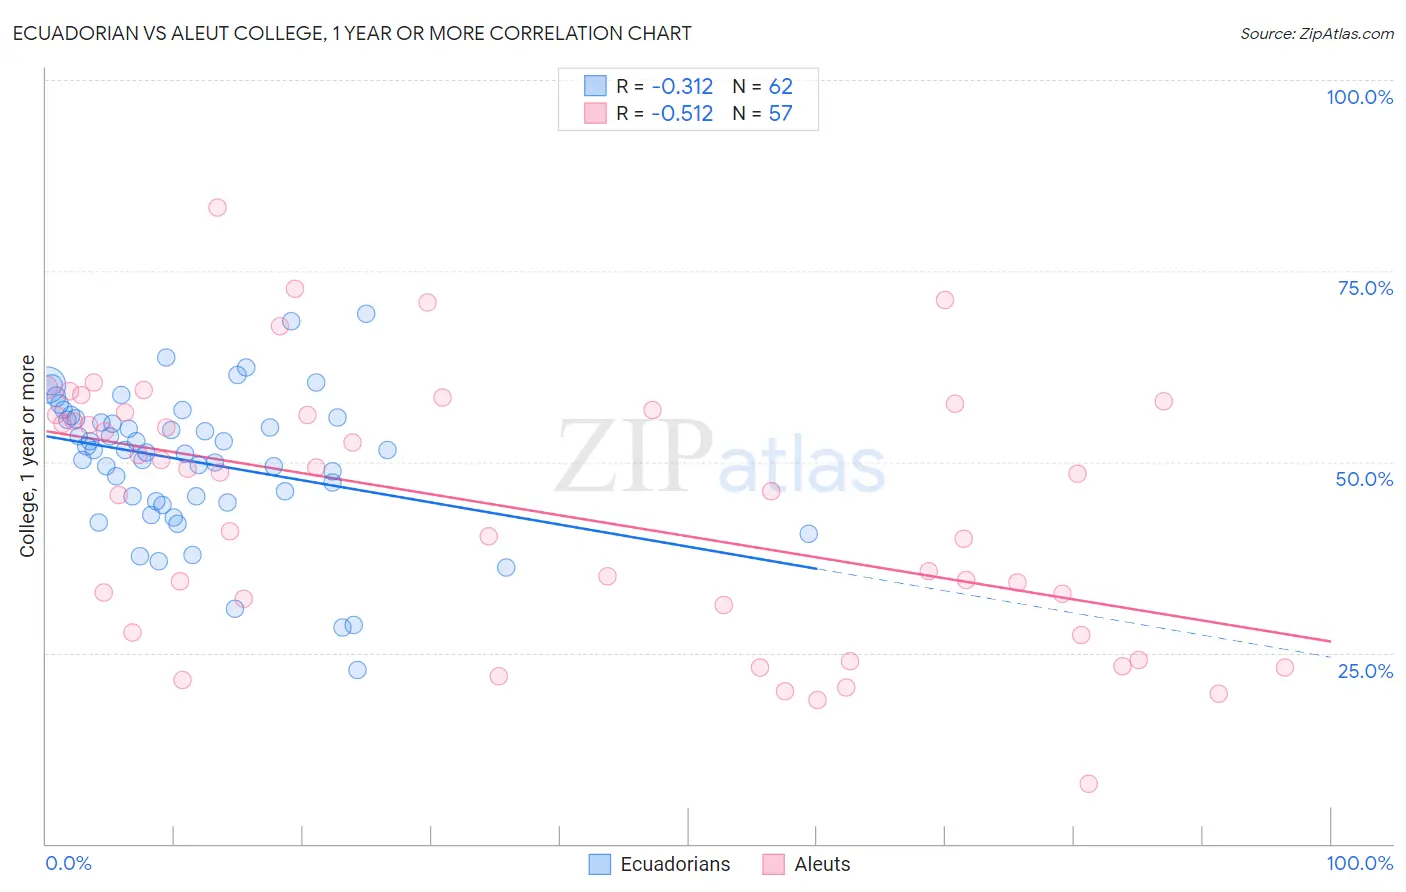
Ecuadorian vs Aleut College, 1 year or more Correlation Chart
The statistical analysis conducted on geographies consisting of 317,865,755 people shows a mild negative correlation between the proportion of Ecuadorians and percentage of population with at least college, 1 year or more education in the United States with a correlation coefficient (R) of -0.312 and weighted average of 54.3%. Similarly, the statistical analysis conducted on geographies consisting of 61,782,916 people shows a substantial negative correlation between the proportion of Aleuts and percentage of population with at least college, 1 year or more education in the United States with a correlation coefficient (R) of -0.512 and weighted average of 55.4%, a difference of 2.0%.
College, 1 year or more Correlation Summary
| Measurement | Ecuadorian | Aleut |
| Minimum | 22.7% | 7.9% |
| Maximum | 69.4% | 83.3% |
| Range | 46.6% | 75.4% |
| Mean | 50.0% | 43.9% |
| Median | 51.5% | 48.5% |
| Interquartile 25% (IQ1) | 44.9% | 29.5% |
| Interquartile 75% (IQ3) | 55.7% | 56.7% |
| Interquartile Range (IQR) | 10.7% | 27.2% |
| Standard Deviation (Sample) | 9.3% | 16.9% |
| Standard Deviation (Population) | 9.2% | 16.7% |
Similar Demographics by College, 1 year or more
Demographics Similar to Ecuadorians by College, 1 year or more
In terms of college, 1 year or more, the demographic groups most similar to Ecuadorians are Shoshone (54.3%, a difference of 0.040%), American (54.4%, a difference of 0.12%), Belizean (54.4%, a difference of 0.15%), Immigrants from Grenada (54.4%, a difference of 0.19%), and Comanche (54.4%, a difference of 0.22%).
| Demographics | Rating | Rank | College, 1 year or more |
| Crow | 0.2 /100 | #270 | Tragic 54.5% |
| Bahamians | 0.2 /100 | #271 | Tragic 54.5% |
| Comanche | 0.2 /100 | #272 | Tragic 54.4% |
| Immigrants | Grenada | 0.2 /100 | #273 | Tragic 54.4% |
| Belizeans | 0.2 /100 | #274 | Tragic 54.4% |
| Americans | 0.2 /100 | #275 | Tragic 54.4% |
| Shoshone | 0.2 /100 | #276 | Tragic 54.3% |
| Ecuadorians | 0.2 /100 | #277 | Tragic 54.3% |
| Immigrants | Jamaica | 0.1 /100 | #278 | Tragic 54.2% |
| Arapaho | 0.1 /100 | #279 | Tragic 54.1% |
| Cheyenne | 0.1 /100 | #280 | Tragic 54.1% |
| Colville | 0.1 /100 | #281 | Tragic 54.1% |
| Guyanese | 0.1 /100 | #282 | Tragic 54.1% |
| Nicaraguans | 0.1 /100 | #283 | Tragic 53.9% |
| Ute | 0.1 /100 | #284 | Tragic 53.8% |
Demographics Similar to Aleuts by College, 1 year or more
In terms of college, 1 year or more, the demographic groups most similar to Aleuts are Immigrants from Cambodia (55.4%, a difference of 0.030%), Immigrants from Barbados (55.4%, a difference of 0.11%), Delaware (55.5%, a difference of 0.12%), Immigrants from Trinidad and Tobago (55.5%, a difference of 0.14%), and Immigrants from Congo (55.6%, a difference of 0.24%).
| Demographics | Rating | Rank | College, 1 year or more |
| Immigrants | Liberia | 0.8 /100 | #245 | Tragic 55.7% |
| Malaysians | 0.8 /100 | #246 | Tragic 55.6% |
| Hawaiians | 0.8 /100 | #247 | Tragic 55.6% |
| Immigrants | Congo | 0.8 /100 | #248 | Tragic 55.6% |
| Immigrants | Trinidad and Tobago | 0.7 /100 | #249 | Tragic 55.5% |
| Delaware | 0.7 /100 | #250 | Tragic 55.5% |
| Immigrants | Cambodia | 0.6 /100 | #251 | Tragic 55.4% |
| Aleuts | 0.6 /100 | #252 | Tragic 55.4% |
| Immigrants | Barbados | 0.6 /100 | #253 | Tragic 55.4% |
| Japanese | 0.5 /100 | #254 | Tragic 55.2% |
| Immigrants | Bahamas | 0.5 /100 | #255 | Tragic 55.2% |
| Immigrants | West Indies | 0.5 /100 | #256 | Tragic 55.2% |
| Indonesians | 0.4 /100 | #257 | Tragic 55.1% |
| Africans | 0.4 /100 | #258 | Tragic 55.0% |
| Nepalese | 0.3 /100 | #259 | Tragic 54.9% |