Ecuadorian vs Aleut Unemployment Among Ages 60 to 64 years
COMPARE
Ecuadorian
Aleut
Unemployment Among Ages 60 to 64 years
Unemployment Among Ages 60 to 64 years Comparison
Ecuadorians
Aleuts
5.8%
UNEMPLOYMENT AMONG AGES 60 TO 64 YEARS
0.0/ 100
METRIC RATING
322nd/ 347
METRIC RANK
6.8%
UNEMPLOYMENT AMONG AGES 60 TO 64 YEARS
0.0/ 100
METRIC RATING
342nd/ 347
METRIC RANK
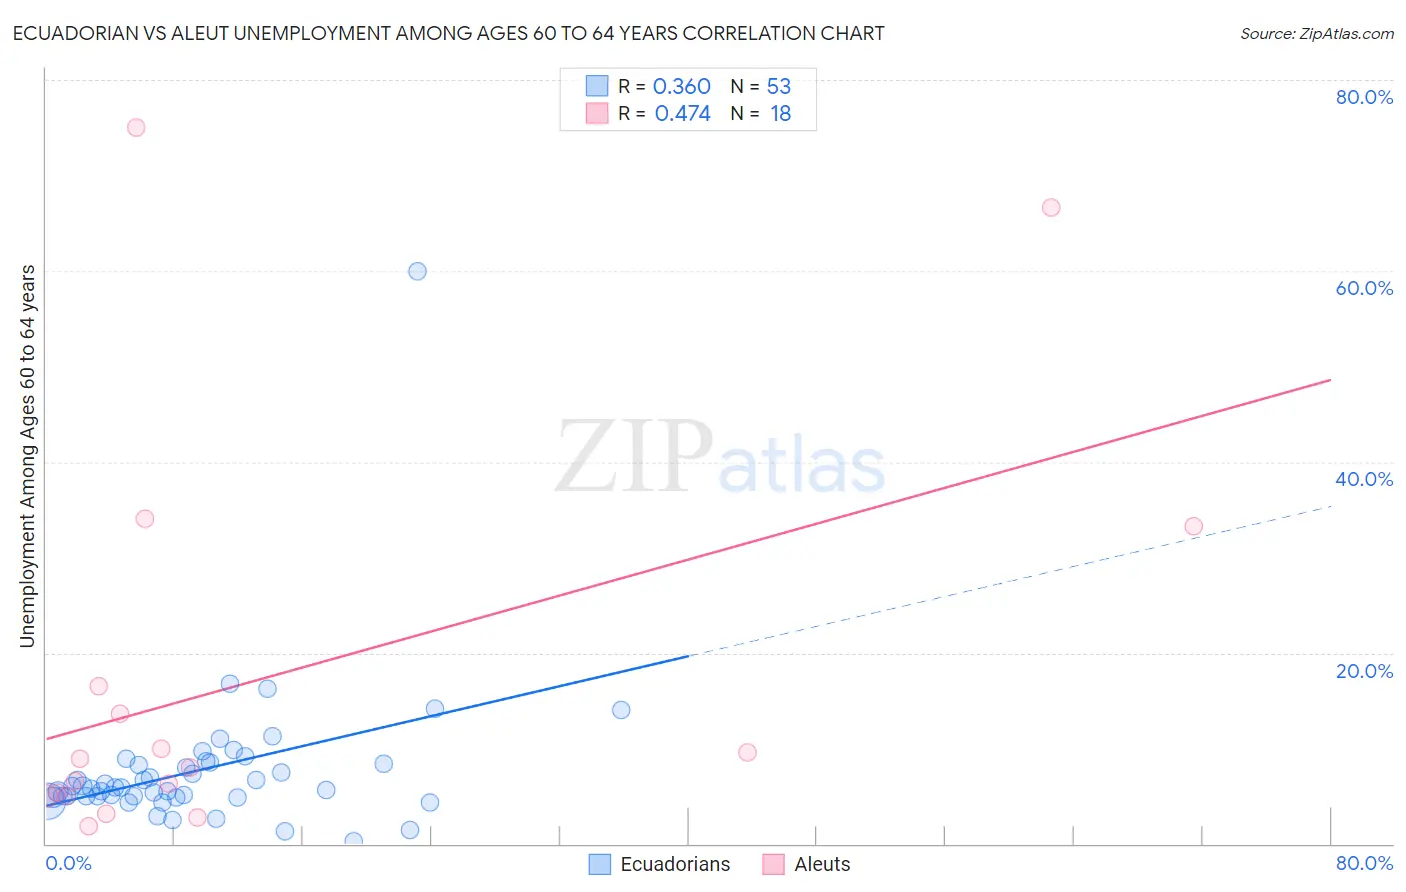
Ecuadorian vs Aleut Unemployment Among Ages 60 to 64 years Correlation Chart
The statistical analysis conducted on geographies consisting of 296,354,650 people shows a mild positive correlation between the proportion of Ecuadorians and unemployment rate among population between the ages 60 and 64 in the United States with a correlation coefficient (R) of 0.360 and weighted average of 5.8%. Similarly, the statistical analysis conducted on geographies consisting of 59,800,117 people shows a moderate positive correlation between the proportion of Aleuts and unemployment rate among population between the ages 60 and 64 in the United States with a correlation coefficient (R) of 0.474 and weighted average of 6.8%, a difference of 17.7%.
Unemployment Among Ages 60 to 64 years Correlation Summary
| Measurement | Ecuadorian | Aleut |
| Minimum | 0.30% | 1.8% |
| Maximum | 60.0% | 75.0% |
| Range | 59.7% | 73.2% |
| Mean | 7.7% | 17.3% |
| Median | 5.9% | 8.5% |
| Interquartile 25% (IQ1) | 4.9% | 5.0% |
| Interquartile 75% (IQ3) | 8.4% | 16.5% |
| Interquartile Range (IQR) | 3.5% | 11.6% |
| Standard Deviation (Sample) | 8.1% | 21.6% |
| Standard Deviation (Population) | 8.0% | 21.0% |
Demographics Similar to Ecuadorians and Aleuts by Unemployment Among Ages 60 to 64 years
In terms of unemployment among ages 60 to 64 years, the demographic groups most similar to Ecuadorians are Alsatian (5.8%, a difference of 0.61%), Immigrants from Ecuador (5.8%, a difference of 0.96%), Paiute (5.8%, a difference of 0.96%), Immigrants from St. Vincent and the Grenadines (5.9%, a difference of 1.9%), and Immigrants from Grenada (5.9%, a difference of 2.0%). Similarly, the demographic groups most similar to Aleuts are Yuman (6.8%, a difference of 0.010%), Pueblo (6.7%, a difference of 0.54%), Tlingit-Haida (6.4%, a difference of 6.1%), Arapaho (6.3%, a difference of 7.6%), and Navajo (6.3%, a difference of 8.1%).
| Demographics | Rating | Rank | Unemployment Among Ages 60 to 64 years |
| Ecuadorians | 0.0 /100 | #322 | Tragic 5.8% |
| Alsatians | 0.0 /100 | #323 | Tragic 5.8% |
| Immigrants | Ecuador | 0.0 /100 | #324 | Tragic 5.8% |
| Paiute | 0.0 /100 | #325 | Tragic 5.8% |
| Immigrants | St. Vincent and the Grenadines | 0.0 /100 | #326 | Tragic 5.9% |
| Immigrants | Grenada | 0.0 /100 | #327 | Tragic 5.9% |
| Apache | 0.0 /100 | #328 | Tragic 6.0% |
| Immigrants | Bangladesh | 0.0 /100 | #329 | Tragic 6.0% |
| Immigrants | Armenia | 0.0 /100 | #330 | Tragic 6.0% |
| Yakama | 0.0 /100 | #331 | Tragic 6.0% |
| Dominicans | 0.0 /100 | #332 | Tragic 6.0% |
| Immigrants | Dominican Republic | 0.0 /100 | #333 | Tragic 6.0% |
| Puerto Ricans | 0.0 /100 | #334 | Tragic 6.1% |
| Vietnamese | 0.0 /100 | #335 | Tragic 6.1% |
| Kiowa | 0.0 /100 | #336 | Tragic 6.2% |
| Navajo | 0.0 /100 | #337 | Tragic 6.3% |
| Arapaho | 0.0 /100 | #338 | Tragic 6.3% |
| Tlingit-Haida | 0.0 /100 | #339 | Tragic 6.4% |
| Pueblo | 0.0 /100 | #340 | Tragic 6.7% |
| Yuman | 0.0 /100 | #341 | Tragic 6.8% |
| Aleuts | 0.0 /100 | #342 | Tragic 6.8% |