Ecuadorian vs Fijian No Schooling Completed
COMPARE
Ecuadorian
Fijian
No Schooling Completed
No Schooling Completed Comparison
Ecuadorians
Fijians
3.0%
NO SCHOOLING COMPLETED
0.0/ 100
METRIC RATING
305th/ 347
METRIC RANK
2.5%
NO SCHOOLING COMPLETED
0.4/ 100
METRIC RATING
266th/ 347
METRIC RANK
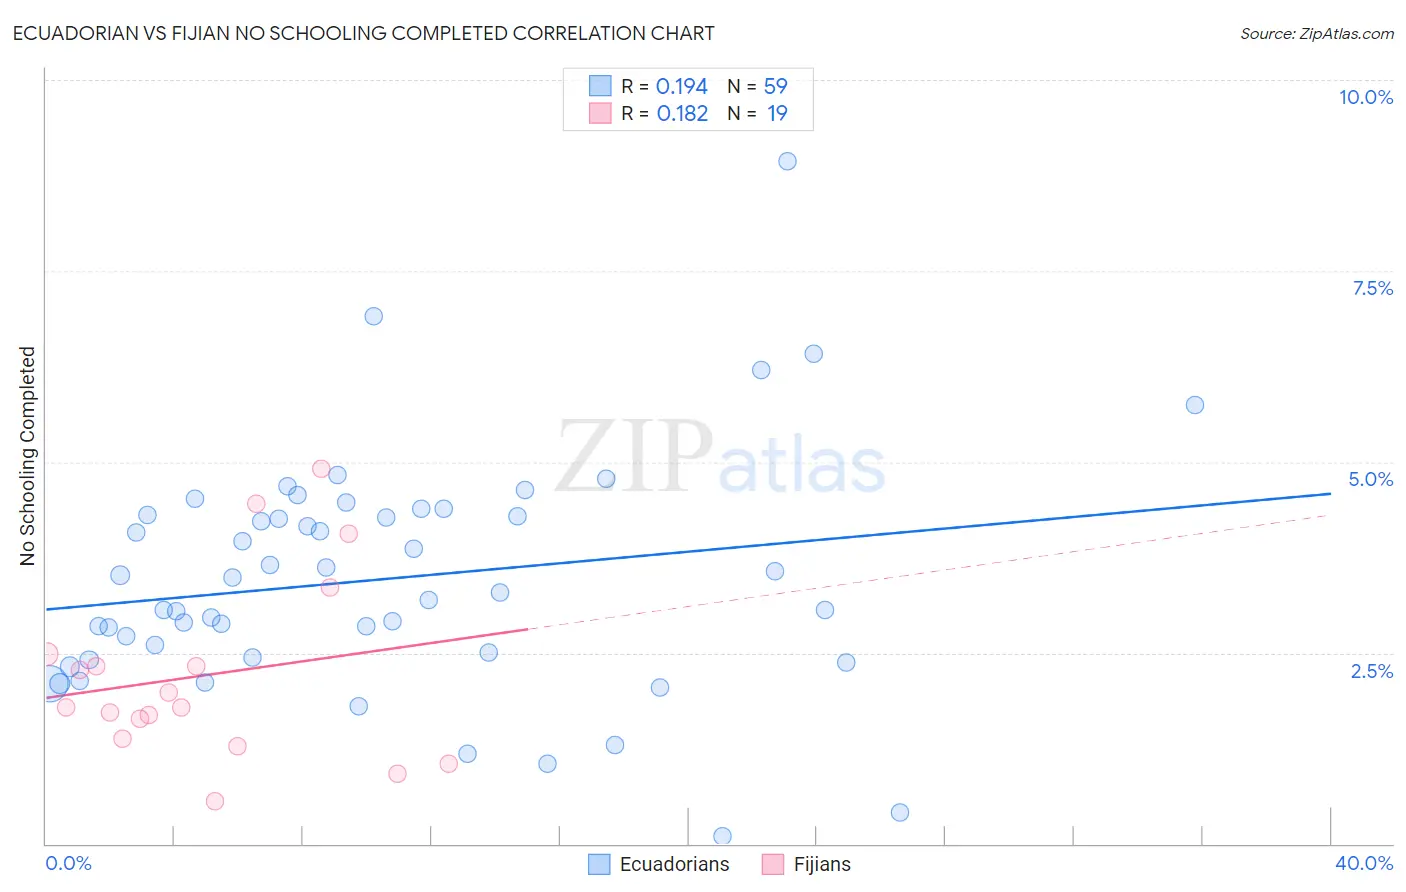
Ecuadorian vs Fijian No Schooling Completed Correlation Chart
The statistical analysis conducted on geographies consisting of 315,790,309 people shows a poor positive correlation between the proportion of Ecuadorians and percentage of population with no schooling in the United States with a correlation coefficient (R) of 0.194 and weighted average of 3.0%. Similarly, the statistical analysis conducted on geographies consisting of 55,808,441 people shows a poor positive correlation between the proportion of Fijians and percentage of population with no schooling in the United States with a correlation coefficient (R) of 0.182 and weighted average of 2.5%, a difference of 19.1%.
No Schooling Completed Correlation Summary
| Measurement | Ecuadorian | Fijian |
| Minimum | 0.10% | 0.56% |
| Maximum | 8.9% | 4.9% |
| Range | 8.8% | 4.4% |
| Mean | 3.5% | 2.2% |
| Median | 3.3% | 1.8% |
| Interquartile 25% (IQ1) | 2.4% | 1.4% |
| Interquartile 75% (IQ3) | 4.3% | 2.5% |
| Interquartile Range (IQR) | 1.9% | 1.1% |
| Standard Deviation (Sample) | 1.5% | 1.2% |
| Standard Deviation (Population) | 1.5% | 1.2% |
Similar Demographics by No Schooling Completed
Demographics Similar to Ecuadorians by No Schooling Completed
In terms of no schooling completed, the demographic groups most similar to Ecuadorians are Nicaraguan (2.9%, a difference of 0.47%), Somali (2.9%, a difference of 0.66%), Immigrants from Caribbean (2.9%, a difference of 1.7%), Belizean (3.0%, a difference of 1.7%), and Immigrants from Haiti (3.0%, a difference of 1.7%).
| Demographics | Rating | Rank | No Schooling Completed |
| Immigrants | Dominica | 0.0 /100 | #298 | Tragic 2.8% |
| Central American Indians | 0.0 /100 | #299 | Tragic 2.8% |
| Haitians | 0.0 /100 | #300 | Tragic 2.9% |
| Immigrants | South Eastern Asia | 0.0 /100 | #301 | Tragic 2.9% |
| Immigrants | Caribbean | 0.0 /100 | #302 | Tragic 2.9% |
| Somalis | 0.0 /100 | #303 | Tragic 2.9% |
| Nicaraguans | 0.0 /100 | #304 | Tragic 2.9% |
| Ecuadorians | 0.0 /100 | #305 | Tragic 3.0% |
| Belizeans | 0.0 /100 | #306 | Tragic 3.0% |
| Immigrants | Haiti | 0.0 /100 | #307 | Tragic 3.0% |
| Immigrants | Somalia | 0.0 /100 | #308 | Tragic 3.0% |
| Hispanics or Latinos | 0.0 /100 | #309 | Tragic 3.0% |
| Guyanese | 0.0 /100 | #310 | Tragic 3.0% |
| Immigrants | Azores | 0.0 /100 | #311 | Tragic 3.0% |
| Sri Lankans | 0.0 /100 | #312 | Tragic 3.0% |
Demographics Similar to Fijians by No Schooling Completed
In terms of no schooling completed, the demographic groups most similar to Fijians are West Indian (2.5%, a difference of 0.080%), Yuman (2.5%, a difference of 0.17%), Indian (Asian) (2.5%, a difference of 0.26%), Immigrants from Liberia (2.5%, a difference of 0.39%), and Taiwanese (2.5%, a difference of 0.44%).
| Demographics | Rating | Rank | No Schooling Completed |
| Immigrants | Jamaica | 0.6 /100 | #259 | Tragic 2.5% |
| Immigrants | Ethiopia | 0.6 /100 | #260 | Tragic 2.5% |
| Armenians | 0.5 /100 | #261 | Tragic 2.5% |
| Immigrants | Sierra Leone | 0.5 /100 | #262 | Tragic 2.5% |
| Immigrants | Liberia | 0.4 /100 | #263 | Tragic 2.5% |
| Indians (Asian) | 0.4 /100 | #264 | Tragic 2.5% |
| West Indians | 0.4 /100 | #265 | Tragic 2.5% |
| Fijians | 0.4 /100 | #266 | Tragic 2.5% |
| Yuman | 0.4 /100 | #267 | Tragic 2.5% |
| Taiwanese | 0.3 /100 | #268 | Tragic 2.5% |
| Immigrants | Nigeria | 0.2 /100 | #269 | Tragic 2.5% |
| Immigrants | Peru | 0.2 /100 | #270 | Tragic 2.5% |
| Cubans | 0.2 /100 | #271 | Tragic 2.5% |
| Immigrants | Bolivia | 0.2 /100 | #272 | Tragic 2.5% |
| Immigrants | Cameroon | 0.1 /100 | #273 | Tragic 2.5% |