Luxembourger vs Romanian College, Under 1 year
COMPARE
Luxembourger
Romanian
College, Under 1 year
College, Under 1 year Comparison
Luxembourgers
Romanians
68.2%
COLLEGE, UNDER 1 YEAR
98.1/ 100
METRIC RATING
92nd/ 347
METRIC RANK
68.2%
COLLEGE, UNDER 1 YEAR
97.9/ 100
METRIC RATING
93rd/ 347
METRIC RANK
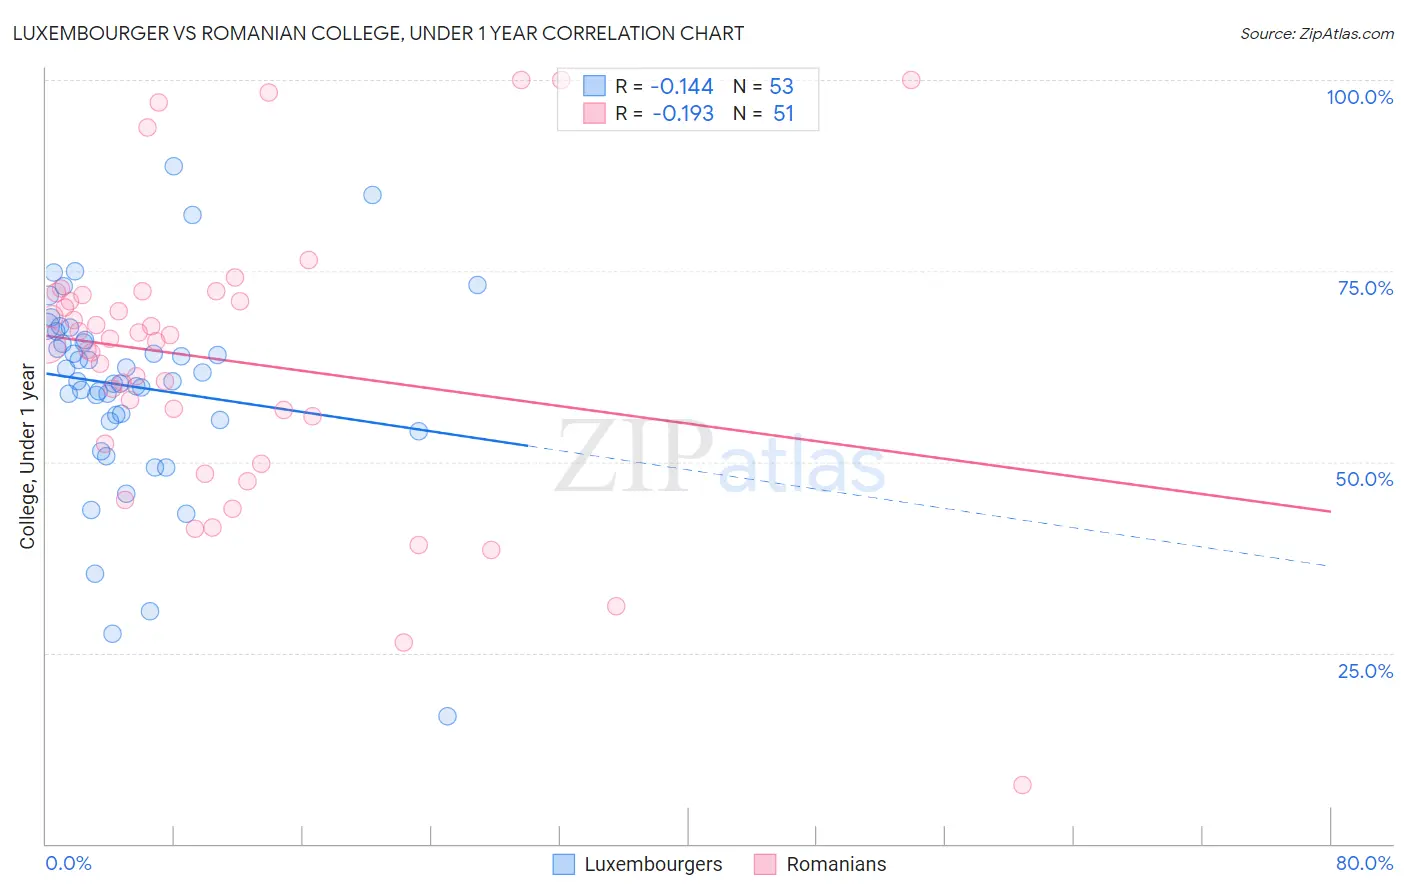
Luxembourger vs Romanian College, Under 1 year Correlation Chart
The statistical analysis conducted on geographies consisting of 144,676,190 people shows a poor negative correlation between the proportion of Luxembourgers and percentage of population with at least college, under 1 year education in the United States with a correlation coefficient (R) of -0.144 and weighted average of 68.2%. Similarly, the statistical analysis conducted on geographies consisting of 377,903,335 people shows a poor negative correlation between the proportion of Romanians and percentage of population with at least college, under 1 year education in the United States with a correlation coefficient (R) of -0.193 and weighted average of 68.2%, a difference of 0.090%.
College, Under 1 year Correlation Summary
| Measurement | Luxembourger | Romanian |
| Minimum | 16.7% | 7.6% |
| Maximum | 88.7% | 100.0% |
| Range | 72.1% | 92.4% |
| Mean | 59.8% | 63.3% |
| Median | 60.6% | 65.8% |
| Interquartile 25% (IQ1) | 55.4% | 52.4% |
| Interquartile 75% (IQ3) | 66.5% | 71.8% |
| Interquartile Range (IQR) | 11.1% | 19.5% |
| Standard Deviation (Sample) | 13.2% | 18.8% |
| Standard Deviation (Population) | 13.1% | 18.7% |
Demographics Similar to Luxembourgers and Romanians by College, Under 1 year
In terms of college, under 1 year, the demographic groups most similar to Luxembourgers are European (68.2%, a difference of 0.010%), Icelander (68.3%, a difference of 0.040%), Ethiopian (68.3%, a difference of 0.10%), Croatian (68.3%, a difference of 0.11%), and Chinese (68.3%, a difference of 0.12%). Similarly, the demographic groups most similar to Romanians are Armenian (68.1%, a difference of 0.090%), European (68.2%, a difference of 0.10%), Icelander (68.3%, a difference of 0.13%), Ethiopian (68.3%, a difference of 0.19%), and Immigrants from Pakistan (68.0%, a difference of 0.19%).
| Demographics | Rating | Rank | College, Under 1 year |
| Norwegians | 98.4 /100 | #82 | Exceptional 68.4% |
| Argentineans | 98.4 /100 | #83 | Exceptional 68.4% |
| Immigrants | Hungary | 98.3 /100 | #84 | Exceptional 68.3% |
| Egyptians | 98.3 /100 | #85 | Exceptional 68.3% |
| Immigrants | Lebanon | 98.3 /100 | #86 | Exceptional 68.3% |
| Chinese | 98.3 /100 | #87 | Exceptional 68.3% |
| Croatians | 98.2 /100 | #88 | Exceptional 68.3% |
| Ethiopians | 98.2 /100 | #89 | Exceptional 68.3% |
| Icelanders | 98.1 /100 | #90 | Exceptional 68.3% |
| Europeans | 98.1 /100 | #91 | Exceptional 68.2% |
| Luxembourgers | 98.1 /100 | #92 | Exceptional 68.2% |
| Romanians | 97.9 /100 | #93 | Exceptional 68.2% |
| Armenians | 97.7 /100 | #94 | Exceptional 68.1% |
| Immigrants | Pakistan | 97.5 /100 | #95 | Exceptional 68.0% |
| Jordanians | 97.4 /100 | #96 | Exceptional 68.0% |
| Immigrants | Ethiopia | 97.3 /100 | #97 | Exceptional 68.0% |
| Paraguayans | 97.1 /100 | #98 | Exceptional 67.9% |
| Immigrants | Bolivia | 97.0 /100 | #99 | Exceptional 67.9% |
| Immigrants | Argentina | 97.0 /100 | #100 | Exceptional 67.9% |
| Immigrants | Eastern Europe | 96.9 /100 | #101 | Exceptional 67.9% |
| Palestinians | 96.9 /100 | #102 | Exceptional 67.9% |