Dominican vs Romanian In Labor Force | Age 35-44
COMPARE
Dominican
Romanian
In Labor Force | Age 35-44
In Labor Force | Age 35-44 Comparison
Dominicans
Romanians
83.1%
IN LABOR FORCE | AGE 35-44
0.0/ 100
METRIC RATING
280th/ 347
METRIC RANK
84.5%
IN LABOR FORCE | AGE 35-44
72.1/ 100
METRIC RATING
151st/ 347
METRIC RANK
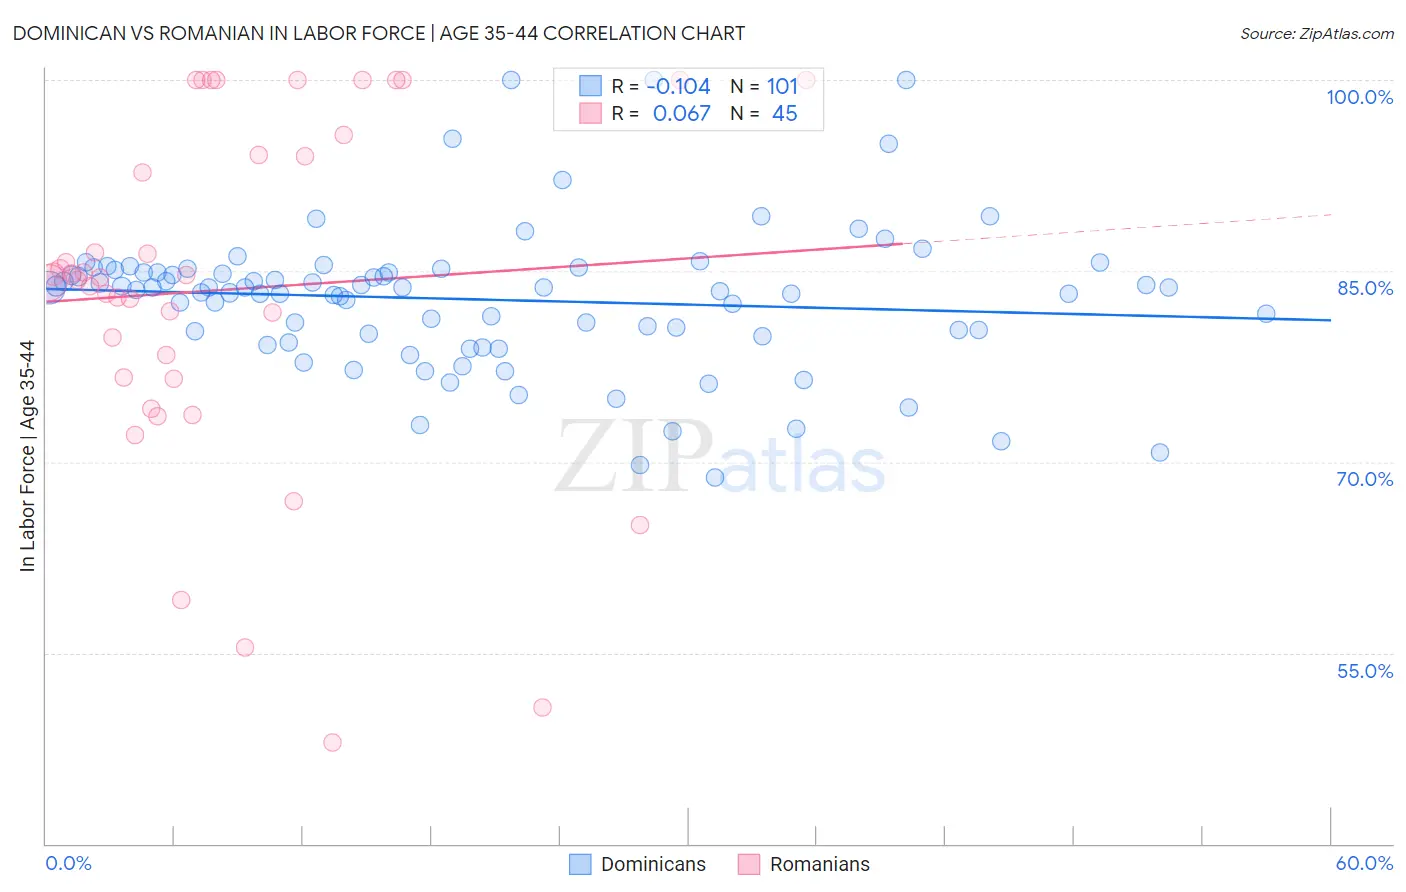
Dominican vs Romanian In Labor Force | Age 35-44 Correlation Chart
The statistical analysis conducted on geographies consisting of 354,840,200 people shows a poor negative correlation between the proportion of Dominicans and labor force participation rate among population between the ages 35 and 44 in the United States with a correlation coefficient (R) of -0.104 and weighted average of 83.1%. Similarly, the statistical analysis conducted on geographies consisting of 377,740,706 people shows a slight positive correlation between the proportion of Romanians and labor force participation rate among population between the ages 35 and 44 in the United States with a correlation coefficient (R) of 0.067 and weighted average of 84.5%, a difference of 1.7%.
In Labor Force | Age 35-44 Correlation Summary
| Measurement | Dominican | Romanian |
| Minimum | 68.8% | 48.0% |
| Maximum | 100.0% | 100.0% |
| Range | 31.2% | 52.0% |
| Mean | 82.8% | 83.5% |
| Median | 83.7% | 84.5% |
| Interquartile 25% (IQ1) | 80.0% | 76.6% |
| Interquartile 75% (IQ3) | 85.0% | 94.9% |
| Interquartile Range (IQR) | 5.0% | 18.3% |
| Standard Deviation (Sample) | 5.7% | 13.6% |
| Standard Deviation (Population) | 5.6% | 13.4% |
Similar Demographics by In Labor Force | Age 35-44
Demographics Similar to Dominicans by In Labor Force | Age 35-44
In terms of in labor force | age 35-44, the demographic groups most similar to Dominicans are Immigrants from Micronesia (83.1%, a difference of 0.040%), Belizean (83.1%, a difference of 0.050%), Delaware (83.2%, a difference of 0.13%), Samoan (83.2%, a difference of 0.13%), and Guatemalan (83.0%, a difference of 0.13%).
| Demographics | Rating | Rank | In Labor Force | Age 35-44 |
| Spanish | 0.0 /100 | #273 | Tragic 83.2% |
| Immigrants | Nonimmigrants | 0.0 /100 | #274 | Tragic 83.2% |
| Hawaiians | 0.0 /100 | #275 | Tragic 83.2% |
| Delaware | 0.0 /100 | #276 | Tragic 83.2% |
| Samoans | 0.0 /100 | #277 | Tragic 83.2% |
| Belizeans | 0.0 /100 | #278 | Tragic 83.1% |
| Immigrants | Micronesia | 0.0 /100 | #279 | Tragic 83.1% |
| Dominicans | 0.0 /100 | #280 | Tragic 83.1% |
| Guatemalans | 0.0 /100 | #281 | Tragic 83.0% |
| Osage | 0.0 /100 | #282 | Tragic 82.9% |
| Immigrants | Guatemala | 0.0 /100 | #283 | Tragic 82.9% |
| Immigrants | Dominican Republic | 0.0 /100 | #284 | Tragic 82.9% |
| Fijians | 0.0 /100 | #285 | Tragic 82.9% |
| Immigrants | Bangladesh | 0.0 /100 | #286 | Tragic 82.9% |
| Immigrants | Belize | 0.0 /100 | #287 | Tragic 82.9% |
Demographics Similar to Romanians by In Labor Force | Age 35-44
In terms of in labor force | age 35-44, the demographic groups most similar to Romanians are South American Indian (84.5%, a difference of 0.010%), Okinawan (84.5%, a difference of 0.010%), Immigrants from Nigeria (84.5%, a difference of 0.010%), Immigrants from Taiwan (84.5%, a difference of 0.010%), and Trinidadian and Tobagonian (84.5%, a difference of 0.020%).
| Demographics | Rating | Rank | In Labor Force | Age 35-44 |
| Immigrants | Jamaica | 79.4 /100 | #144 | Good 84.6% |
| Immigrants | Saudi Arabia | 79.4 /100 | #145 | Good 84.6% |
| Immigrants | Asia | 78.7 /100 | #146 | Good 84.5% |
| Immigrants | Netherlands | 76.6 /100 | #147 | Good 84.5% |
| South American Indians | 73.6 /100 | #148 | Good 84.5% |
| Okinawans | 73.5 /100 | #149 | Good 84.5% |
| Immigrants | Nigeria | 73.3 /100 | #150 | Good 84.5% |
| Romanians | 72.1 /100 | #151 | Good 84.5% |
| Immigrants | Taiwan | 71.4 /100 | #152 | Good 84.5% |
| Trinidadians and Tobagonians | 69.5 /100 | #153 | Good 84.5% |
| Iranians | 69.4 /100 | #154 | Good 84.5% |
| Immigrants | Switzerland | 65.9 /100 | #155 | Good 84.5% |
| Immigrants | Israel | 64.3 /100 | #156 | Good 84.4% |
| Immigrants | Austria | 63.8 /100 | #157 | Good 84.4% |
| Jamaicans | 62.7 /100 | #158 | Good 84.4% |