Dominican vs Romanian Unemployment Among Women with Children Under 6 years

COMPARE

Dominican
Race
Ancestry
AfghanAfricanAlaska NativeAlaskan AthabascanAlbanianAleutAlsatianAmericanApacheArabArapahoArgentineanArmenianAssyrian/Chaldean/SyriacAustralianAustrianBahamianBangladeshiBarbadianBasqueBelgianBelizeanBermudanBhutaneseBlackfeetBolivianBrazilianBritishBritish West IndianBulgarianBurmeseCajunCambodianCanadianCape VerdeanCarpatho RusynCelticCentral AmericanCentral American IndianCherokeeCheyenneChickasawChileanChineseChippewaChoctawColombianColvilleComancheCosta RicanCreeCreekCroatianCrowCubanCypriotCzechCzechoslovakianDanishDelawareDominicanDutchDutch West IndianEastern EuropeanEcuadorianEgyptianEnglishEstonianEthiopianEuropeanFijianFilipinoFinnishFrenchFrench American IndianFrench CanadianGermanGerman RussianGhanaianGreekGuamanian/ChamorroGuatemalanGuyaneseHaitianHmongHonduranHopiHoumaHungarianIcelanderIndian (Asian)IndonesianInupiatIranianIraqiIrishIroquoisIsraeliItalianJamaicanJapaneseJordanianKenyanKiowaKoreanLaotianLatvianLebaneseLiberianLithuanianLumbeeLuxembourgerMacedonianMalaysianMalteseMarshalleseMenomineeMexicanMexican American IndianMongolianMoroccanNative HawaiianNavajoNepaleseNew ZealanderNicaraguanNigerianNorthern EuropeanNorwegianOkinawanOsageOttawaPaiutePakistaniPalestinianPanamanianParaguayanPennsylvania GermanPeruvianPimaPolishPortuguesePotawatomiPuebloPuerto RicanPuget Sound SalishRussianSalvadoranSamoanScandinavianScotch-IrishScottishSeminoleSenegaleseSerbianShoshoneSierra LeoneanSiouxSlavicSlovakSloveneSomaliSouth AfricanSouth AmericanSouth American IndianSoviet UnionSpaniardSpanishSpanish AmericanSpanish American IndianSri LankanSubsaharan AfricanSudaneseSwedishSwissSyrianTaiwaneseThaiTlingit-HaidaTohono O'OdhamTonganTrinidadian and TobagonianTsimshianTurkishU.S. Virgin IslanderUgandanUkrainianUruguayanUteVenezuelanVietnameseWelshWest IndianYakamaYaquiYugoslavianYumanYup'ikZimbabwean
Immigration
NonimmigrantsImmigrantsAfghanistanAfricaAlbaniaArgentinaArmeniaAsiaAustraliaAustriaBahamasBangladeshBarbadosBelarusBelgiumBelizeBoliviaBosnia and HerzegovinaBrazilBulgariaBurma/MyanmarCabo VerdeCambodiaCameroonCanadaCaribbeanCentral AmericaChileChinaColombiaCongoCosta RicaCroatiaCubaCzechoslovakiaDenmarkDominicaDominican RepublicEastern AfricaEastern AsiaEastern EuropeEcuadorEgyptEl SalvadorEnglandEritreaEthiopiaEuropeFijiFranceGermanyGhanaGreeceGrenadaGuatemalaGuyanaHaitiHondurasHong KongHungaryIndiaIndonesiaIranIraqIrelandIsraelItalyJamaicaJapanJordanKazakhstanKenyaKoreaKuwaitLaosLatin AmericaLatviaLebanonLiberiaLithuaniaMalaysiaMexicoMicronesiaMiddle AfricaMoldovaMoroccoNepalNetherlandsNicaraguaNigeriaNorth AmericaNorth MacedoniaNorthern AfricaNorthern EuropeNorwayOceaniaPakistanPanamaPeruPhilippinesPolandPortugalRomaniaRussiaSaudi ArabiaScotlandSenegalSerbiaSierra LeoneSingaporeSomaliaSouth AfricaSouth AmericaSouth Central AsiaSouth Eastern AsiaSouthern EuropeSpainSri LankaSt. Vincent and the GrenadinesSudanSwedenSwitzerlandSyriaTaiwanThailandTrinidad and TobagoTurkeyUgandaUkraineUruguayUzbekistanVenezuelaVietnamWest IndiesWestern AfricaWestern AsiaWestern EuropeYemenZaireZimbabweAzores
Romanian
Race
Ancestry
AfghanAfricanAlaska NativeAlaskan AthabascanAlbanianAleutAlsatianAmericanApacheArabArapahoArgentineanArmenianAssyrian/Chaldean/SyriacAustralianAustrianBahamianBangladeshiBarbadianBasqueBelgianBelizeanBermudanBhutaneseBlackfeetBolivianBrazilianBritishBritish West IndianBulgarianBurmeseCajunCambodianCanadianCape VerdeanCarpatho RusynCelticCentral AmericanCentral American IndianCherokeeCheyenneChickasawChileanChineseChippewaChoctawColombianColvilleComancheCosta RicanCreeCreekCroatianCrowCubanCypriotCzechCzechoslovakianDanishDelawareDutchDutch West IndianEastern EuropeanEcuadorianEgyptianEnglishEstonianEthiopianEuropeanFijianFilipinoFinnishFrenchFrench American IndianFrench CanadianGermanGerman RussianGhanaianGreekGuamanian/ChamorroGuatemalanGuyaneseHaitianHmongHonduranHopiHoumaHungarianIcelanderIndian (Asian)IndonesianInupiatIranianIraqiIrishIroquoisIsraeliItalianJamaicanJapaneseJordanianKenyanKiowaKoreanLaotianLatvianLebaneseLiberianLithuanianLumbeeLuxembourgerMacedonianMalaysianMalteseMarshalleseMenomineeMexicanMexican American IndianMongolianMoroccanNative HawaiianNavajoNepaleseNew ZealanderNicaraguanNigerianNorthern EuropeanNorwegianOkinawanOsageOttawaPaiutePakistaniPalestinianPanamanianParaguayanPennsylvania GermanPeruvianPimaPolishPortuguesePotawatomiPuebloPuerto RicanPuget Sound SalishRomanianRussianSalvadoranSamoanScandinavianScotch-IrishScottishSeminoleSenegaleseSerbianShoshoneSierra LeoneanSiouxSlavicSlovakSloveneSomaliSouth AfricanSouth AmericanSouth American IndianSoviet UnionSpaniardSpanishSpanish AmericanSpanish American IndianSri LankanSubsaharan AfricanSudaneseSwedishSwissSyrianTaiwaneseThaiTlingit-HaidaTohono O'OdhamTonganTrinidadian and TobagonianTsimshianTurkishU.S. Virgin IslanderUgandanUkrainianUruguayanUteVenezuelanVietnameseWelshWest IndianYakamaYaquiYugoslavianYumanYup'ikZimbabwean
Immigration
NonimmigrantsImmigrantsAfghanistanAfricaAlbaniaArgentinaArmeniaAsiaAustraliaAustriaBahamasBangladeshBarbadosBelarusBelgiumBelizeBoliviaBosnia and HerzegovinaBrazilBulgariaBurma/MyanmarCabo VerdeCambodiaCameroonCanadaCaribbeanCentral AmericaChileChinaColombiaCongoCosta RicaCroatiaCubaCzechoslovakiaDenmarkDominicaDominican RepublicEastern AfricaEastern AsiaEastern EuropeEcuadorEgyptEl SalvadorEnglandEritreaEthiopiaEuropeFijiFranceGermanyGhanaGreeceGrenadaGuatemalaGuyanaHaitiHondurasHong KongHungaryIndiaIndonesiaIranIraqIrelandIsraelItalyJamaicaJapanJordanKazakhstanKenyaKoreaKuwaitLaosLatin AmericaLatviaLebanonLiberiaLithuaniaMalaysiaMexicoMicronesiaMiddle AfricaMoldovaMoroccoNepalNetherlandsNicaraguaNigeriaNorth AmericaNorth MacedoniaNorthern AfricaNorthern EuropeNorwayOceaniaPakistanPanamaPeruPhilippinesPolandPortugalRomaniaRussiaSaudi ArabiaScotlandSenegalSerbiaSierra LeoneSingaporeSomaliaSouth AfricaSouth AmericaSouth Central AsiaSouth Eastern AsiaSouthern EuropeSpainSri LankaSt. Vincent and the GrenadinesSudanSwedenSwitzerlandSyriaTaiwanThailandTrinidad and TobagoTurkeyUgandaUkraineUruguayUzbekistanVenezuelaVietnamWest IndiesWestern AfricaWestern AsiaWestern EuropeYemenZaireZimbabweAzores
Unemployment Among Women with Children Under 6 years
Income
Poverty
Unemployment
Labor Participation
Family Structure
Vehicle Availability
Education Level
Disability

Unemployment Among Women with Children Under 6 years Comparison

Dominicans

Romanians

Tragic
Exceptional
9.1%
UNEMPLOYMENT AMONG WOMEN WITH CHILDREN UNDER 6 YEARS
0.0/ 100
METRIC RATING
307th/ 347
METRIC RANK
7.2%
UNEMPLOYMENT AMONG WOMEN WITH CHILDREN UNDER 6 YEARS
97.7/ 100
METRIC RATING
95th/ 347
METRIC RANK

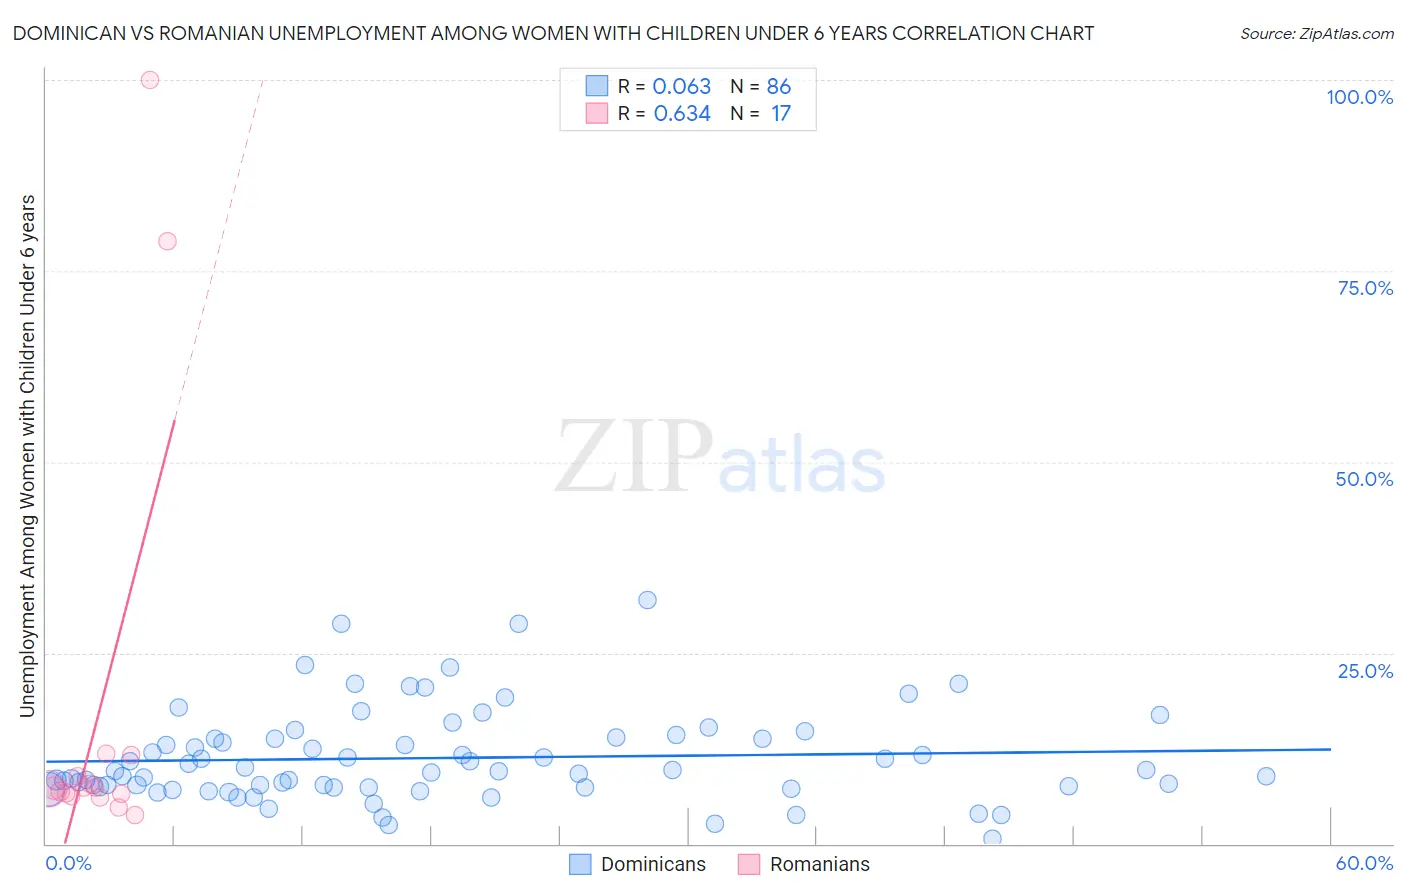
Dominican vs Romanian Unemployment Among Women with Children Under 6 years Correlation Chart

The statistical analysis conducted on geographies consisting of 277,955,592 people shows a slight positive correlation between the proportion of Dominicans and unemployment rate among women with children under the age of 6 in the United States with a correlation coefficient (R) of 0.063 and weighted average of 9.1%. Similarly, the statistical analysis conducted on geographies consisting of 284,479,453 people shows a significant positive correlation between the proportion of Romanians and unemployment rate among women with children under the age of 6 in the United States with a correlation coefficient (R) of 0.634 and weighted average of 7.2%, a difference of 27.2%.
Dominican vs Romanian Unemployment Among Women with Children Under 6 years

Unemployment Among Women with Children Under 6 years Correlation Summary

MeasurementDominicanRomanian
Minimum0.60%3.8%
Maximum31.9%100.0%
Range31.3%96.2%
Mean11.2%17.0%
Median9.5%7.3%
Interquartile 25% (IQ1)7.4%6.4%
Interquartile 75% (IQ3)13.8%10.3%
Interquartile Range (IQR)6.4%3.9%
Standard Deviation (Sample)6.1%27.6%
Standard Deviation (Population)6.0%26.8%

Similar Demographics by Unemployment Among Women with Children Under 6 years

Demographics Similar to Dominicans by Unemployment Among Women with Children Under 6 years

In terms of unemployment among women with children under 6 years, the demographic groups most similar to Dominicans are Immigrants from Micronesia (9.1%, a difference of 0.070%), Pueblo (9.1%, a difference of 0.12%), Alaskan Athabascan (9.1%, a difference of 0.29%), African (9.2%, a difference of 0.46%), and Cajun (9.2%, a difference of 0.59%).
DemographicsRating | RankUnemployment Among Women with Children Under 6 years
Creek
0.0
/100
|
#300
Tragic
8.9%
Chickasaw
0.0
/100
|
#301
Tragic
9.0%
Hispanics or Latinos
0.0
/100
|
#302
Tragic
9.0%
Immigrants | West Indies
0.0
/100
|
#303
Tragic
9.0%
Immigrants | Mexico
0.0
/100
|
#304
Tragic
9.1%
Alaskan Athabascans
0.0
/100
|
#305
Tragic
9.1%
Pueblo
0.0
/100
|
#306
Tragic
9.1%
Dominicans
0.0
/100
|
#307
Tragic
9.1%
Immigrants | Micronesia
0.0
/100
|
#308
Tragic
9.1%
Africans
0.0
/100
|
#309
Tragic
9.2%
Cajuns
0.0
/100
|
#310
Tragic
9.2%
French American Indians
0.0
/100
|
#311
Tragic
9.2%
Immigrants | Azores
0.0
/100
|
#312
Tragic
9.2%
Americans
0.0
/100
|
#313
Tragic
9.3%
Fijians
0.0
/100
|
#314
Tragic
9.3%

Demographics Similar to Romanians by Unemployment Among Women with Children Under 6 years

In terms of unemployment among women with children under 6 years, the demographic groups most similar to Romanians are Immigrants from Eastern Africa (7.2%, a difference of 0.010%), Macedonian (7.2%, a difference of 0.040%), Immigrants from South Eastern Asia (7.2%, a difference of 0.090%), New Zealander (7.2%, a difference of 0.11%), and Russian (7.2%, a difference of 0.12%).
DemographicsRating | RankUnemployment Among Women with Children Under 6 years
Immigrants | Hungary
98.3
/100
|
#88
Exceptional
7.1%
Immigrants | Denmark
98.3
/100
|
#89
Exceptional
7.1%
Immigrants | Spain
98.2
/100
|
#90
Exceptional
7.1%
Danes
98.2
/100
|
#91
Exceptional
7.1%
Albanians
98.0
/100
|
#92
Exceptional
7.2%
New Zealanders
97.8
/100
|
#93
Exceptional
7.2%
Macedonians
97.7
/100
|
#94
Exceptional
7.2%
Romanians
97.7
/100
|
#95
Exceptional
7.2%
Immigrants | Eastern Africa
97.7
/100
|
#96
Exceptional
7.2%
Immigrants | South Eastern Asia
97.6
/100
|
#97
Exceptional
7.2%
Russians
97.5
/100
|
#98
Exceptional
7.2%
Immigrants | Europe
97.5
/100
|
#99
Exceptional
7.2%
Immigrants | Northern Europe
97.4
/100
|
#100
Exceptional
7.2%
Chileans
97.4
/100
|
#101
Exceptional
7.2%
Immigrants | Nicaragua
97.3
/100
|
#102
Exceptional
7.2%