Immigrants from Malaysia vs Kenyan High School Diploma
COMPARE
Immigrants from Malaysia
Kenyan
High School Diploma
High School Diploma Comparison
Immigrants from Malaysia
Kenyans
89.3%
HIGH SCHOOL DIPLOMA
63.5/ 100
METRIC RATING
157th/ 347
METRIC RANK
89.6%
HIGH SCHOOL DIPLOMA
81.4/ 100
METRIC RATING
139th/ 347
METRIC RANK
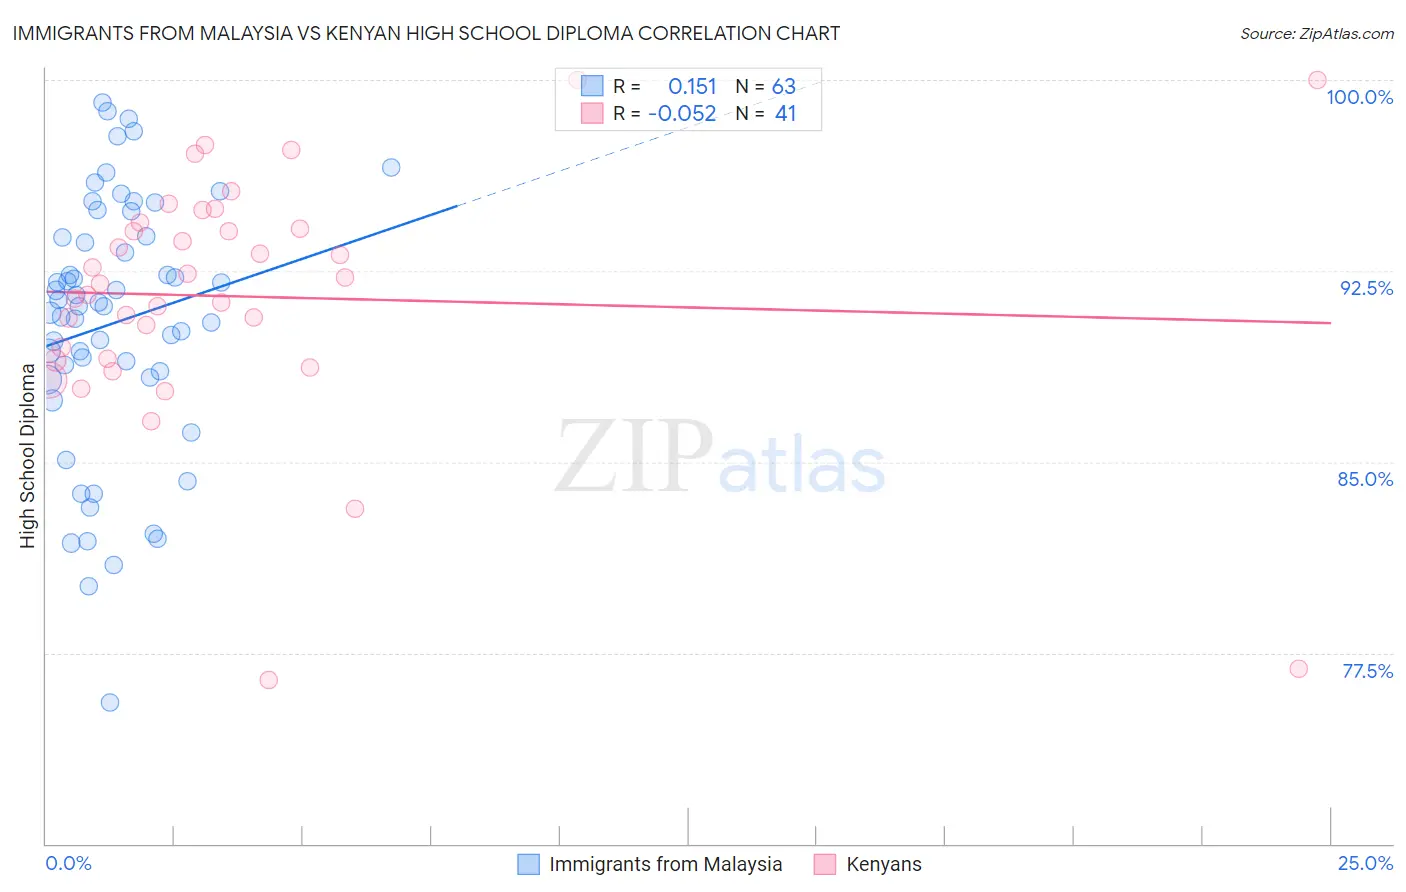
Immigrants from Malaysia vs Kenyan High School Diploma Correlation Chart
The statistical analysis conducted on geographies consisting of 197,973,709 people shows a poor positive correlation between the proportion of Immigrants from Malaysia and percentage of population with at least high school diploma education in the United States with a correlation coefficient (R) of 0.151 and weighted average of 89.3%. Similarly, the statistical analysis conducted on geographies consisting of 168,243,895 people shows a slight negative correlation between the proportion of Kenyans and percentage of population with at least high school diploma education in the United States with a correlation coefficient (R) of -0.052 and weighted average of 89.6%, a difference of 0.35%.
High School Diploma Correlation Summary
| Measurement | Immigrants from Malaysia | Kenyan |
| Minimum | 75.6% | 76.4% |
| Maximum | 99.1% | 100.0% |
| Range | 23.6% | 23.6% |
| Mean | 90.4% | 91.5% |
| Median | 91.1% | 92.0% |
| Interquartile 25% (IQ1) | 88.3% | 89.0% |
| Interquartile 75% (IQ3) | 93.9% | 94.3% |
| Interquartile Range (IQR) | 5.5% | 5.2% |
| Standard Deviation (Sample) | 5.1% | 4.9% |
| Standard Deviation (Population) | 5.1% | 4.8% |
Demographics Similar to Immigrants from Malaysia and Kenyans by High School Diploma
In terms of high school diploma, the demographic groups most similar to Immigrants from Malaysia are Immigrants from Pakistan (89.3%, a difference of 0.020%), Immigrants from Argentina (89.4%, a difference of 0.030%), Alsatian (89.4%, a difference of 0.050%), Immigrants from Northern Africa (89.4%, a difference of 0.050%), and Immigrants from Iraq (89.4%, a difference of 0.090%). Similarly, the demographic groups most similar to Kenyans are Immigrants from Egypt (89.6%, a difference of 0.010%), Assyrian/Chaldean/Syriac (89.7%, a difference of 0.030%), Chilean (89.6%, a difference of 0.060%), Indian (Asian) (89.6%, a difference of 0.060%), and Pakistani (89.6%, a difference of 0.070%).
| Demographics | Rating | Rank | High School Diploma |
| Assyrians/Chaldeans/Syriacs | 82.5 /100 | #138 | Excellent 89.7% |
| Kenyans | 81.4 /100 | #139 | Excellent 89.6% |
| Immigrants | Egypt | 81.2 /100 | #140 | Excellent 89.6% |
| Chileans | 79.0 /100 | #141 | Good 89.6% |
| Indians (Asian) | 78.8 /100 | #142 | Good 89.6% |
| Pakistanis | 78.3 /100 | #143 | Good 89.6% |
| Immigrants | Kenya | 78.0 /100 | #144 | Good 89.6% |
| Immigrants | Brazil | 76.6 /100 | #145 | Good 89.5% |
| Immigrants | Spain | 76.2 /100 | #146 | Good 89.5% |
| Iraqis | 73.9 /100 | #147 | Good 89.5% |
| Immigrants | Lebanon | 73.4 /100 | #148 | Good 89.5% |
| Immigrants | Poland | 72.9 /100 | #149 | Good 89.5% |
| Argentineans | 72.3 /100 | #150 | Good 89.5% |
| Paraguayans | 71.4 /100 | #151 | Good 89.5% |
| Asians | 70.7 /100 | #152 | Good 89.4% |
| Immigrants | Iraq | 68.7 /100 | #153 | Good 89.4% |
| Alsatians | 66.8 /100 | #154 | Good 89.4% |
| Immigrants | Northern Africa | 66.4 /100 | #155 | Good 89.4% |
| Immigrants | Argentina | 65.5 /100 | #156 | Good 89.4% |
| Immigrants | Malaysia | 63.5 /100 | #157 | Good 89.3% |
| Immigrants | Pakistan | 62.5 /100 | #158 | Good 89.3% |