Dominican vs Kenyan Births to Unmarried Women
COMPARE
Dominican
Kenyan
Births to Unmarried Women
Births to Unmarried Women Comparison
Dominicans
Kenyans
39.8%
BIRTHS TO UNMARRIED WOMEN
0.0/ 100
METRIC RATING
315th/ 347
METRIC RANK
31.9%
BIRTHS TO UNMARRIED WOMEN
43.0/ 100
METRIC RATING
182nd/ 347
METRIC RANK
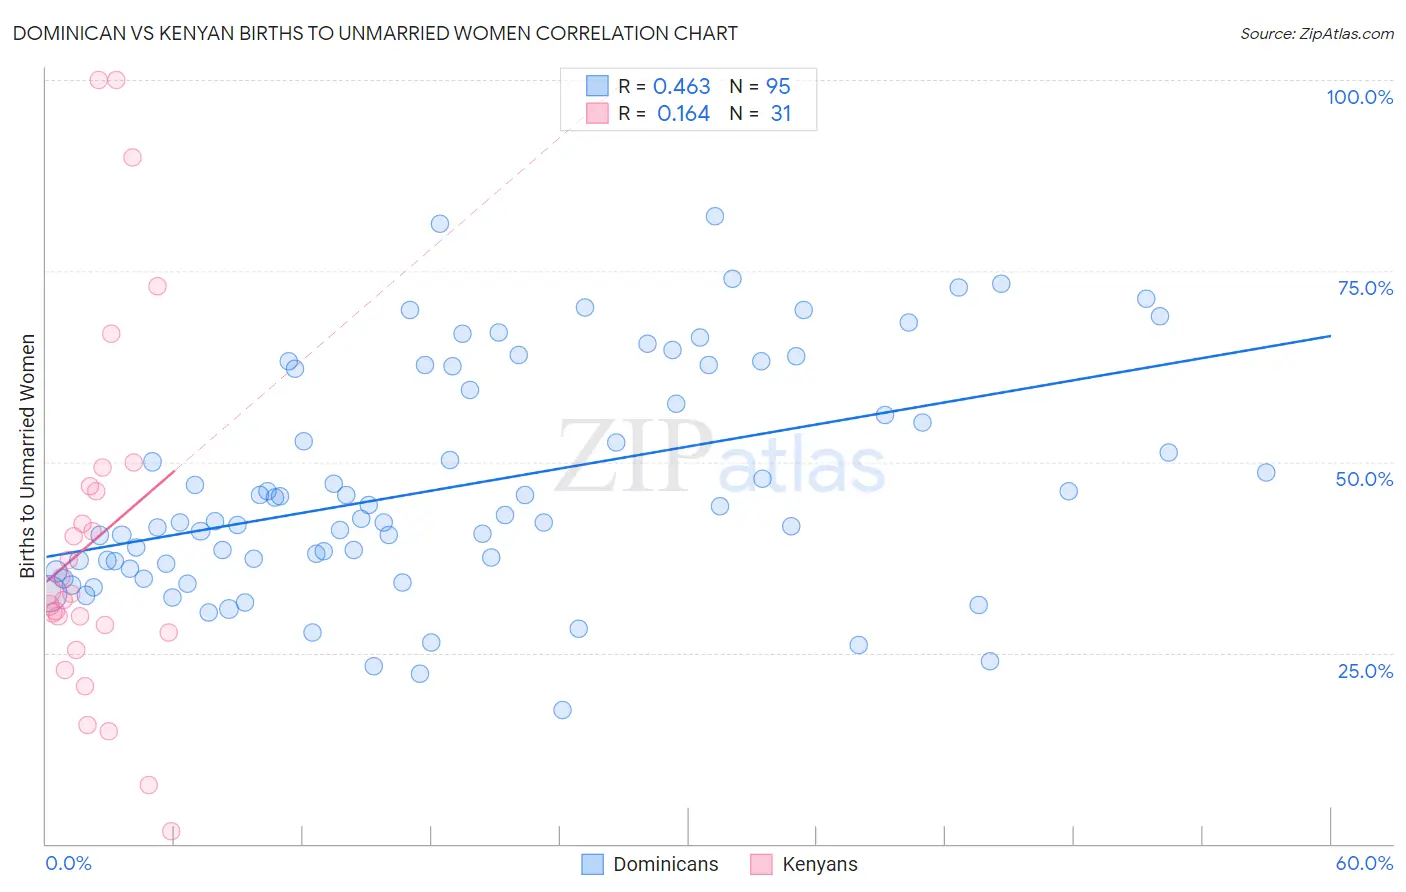
Dominican vs Kenyan Births to Unmarried Women Correlation Chart
The statistical analysis conducted on geographies consisting of 335,131,463 people shows a moderate positive correlation between the proportion of Dominicans and percentage of births to unmarried women in the United States with a correlation coefficient (R) of 0.463 and weighted average of 39.8%. Similarly, the statistical analysis conducted on geographies consisting of 163,852,803 people shows a poor positive correlation between the proportion of Kenyans and percentage of births to unmarried women in the United States with a correlation coefficient (R) of 0.164 and weighted average of 31.9%, a difference of 25.0%.
Births to Unmarried Women Correlation Summary
| Measurement | Dominican | Kenyan |
| Minimum | 17.5% | 1.6% |
| Maximum | 82.1% | 100.0% |
| Range | 64.6% | 98.4% |
| Mean | 46.9% | 39.7% |
| Median | 42.5% | 32.7% |
| Interquartile 25% (IQ1) | 36.6% | 27.6% |
| Interquartile 75% (IQ3) | 62.2% | 46.9% |
| Interquartile Range (IQR) | 25.6% | 19.3% |
| Standard Deviation (Sample) | 14.8% | 24.0% |
| Standard Deviation (Population) | 14.7% | 23.7% |
Similar Demographics by Births to Unmarried Women
Demographics Similar to Dominicans by Births to Unmarried Women
In terms of births to unmarried women, the demographic groups most similar to Dominicans are Immigrants from Caribbean (39.8%, a difference of 0.040%), Apache (39.9%, a difference of 0.060%), African (39.7%, a difference of 0.33%), Immigrants from Dominican Republic (40.1%, a difference of 0.61%), and U.S. Virgin Islander (39.6%, a difference of 0.67%).
| Demographics | Rating | Rank | Births to Unmarried Women |
| Aleuts | 0.0 /100 | #308 | Tragic 39.3% |
| Cubans | 0.0 /100 | #309 | Tragic 39.4% |
| Immigrants | Dominica | 0.0 /100 | #310 | Tragic 39.5% |
| Immigrants | Azores | 0.0 /100 | #311 | Tragic 39.6% |
| U.S. Virgin Islanders | 0.0 /100 | #312 | Tragic 39.6% |
| Africans | 0.0 /100 | #313 | Tragic 39.7% |
| Immigrants | Caribbean | 0.0 /100 | #314 | Tragic 39.8% |
| Dominicans | 0.0 /100 | #315 | Tragic 39.8% |
| Apache | 0.0 /100 | #316 | Tragic 39.9% |
| Immigrants | Dominican Republic | 0.0 /100 | #317 | Tragic 40.1% |
| Immigrants | Bahamas | 0.0 /100 | #318 | Tragic 40.1% |
| Yakama | 0.0 /100 | #319 | Tragic 40.3% |
| Crow | 0.0 /100 | #320 | Tragic 40.4% |
| Bahamians | 0.0 /100 | #321 | Tragic 40.8% |
| Cajuns | 0.0 /100 | #322 | Tragic 41.0% |
Demographics Similar to Kenyans by Births to Unmarried Women
In terms of births to unmarried women, the demographic groups most similar to Kenyans are Canadian (31.9%, a difference of 0.16%), Immigrants from Peru (31.8%, a difference of 0.20%), Immigrants from South America (32.0%, a difference of 0.23%), Moroccan (31.8%, a difference of 0.26%), and German (32.0%, a difference of 0.34%).
| Demographics | Rating | Rank | Births to Unmarried Women |
| Immigrants | Venezuela | 49.2 /100 | #175 | Average 31.7% |
| Scottish | 48.1 /100 | #176 | Average 31.7% |
| South American Indians | 47.7 /100 | #177 | Average 31.7% |
| English | 47.4 /100 | #178 | Average 31.7% |
| South Americans | 46.9 /100 | #179 | Average 31.8% |
| Moroccans | 45.7 /100 | #180 | Average 31.8% |
| Immigrants | Peru | 45.1 /100 | #181 | Average 31.8% |
| Kenyans | 43.0 /100 | #182 | Average 31.9% |
| Canadians | 41.4 /100 | #183 | Average 31.9% |
| Immigrants | South America | 40.7 /100 | #184 | Average 32.0% |
| Germans | 39.5 /100 | #185 | Fair 32.0% |
| Welsh | 38.2 /100 | #186 | Fair 32.0% |
| Czechoslovakians | 38.0 /100 | #187 | Fair 32.0% |
| Osage | 37.1 /100 | #188 | Fair 32.1% |
| Immigrants | Kenya | 36.9 /100 | #189 | Fair 32.1% |