Okinawan vs Immigrants from Denmark No Schooling Completed
COMPARE
Okinawan
Immigrants from Denmark
No Schooling Completed
No Schooling Completed Comparison
Okinawans
Immigrants from Denmark
1.8%
NO SCHOOLING COMPLETED
97.1/ 100
METRIC RATING
108th/ 347
METRIC RANK
1.7%
NO SCHOOLING COMPLETED
99.2/ 100
METRIC RATING
84th/ 347
METRIC RANK
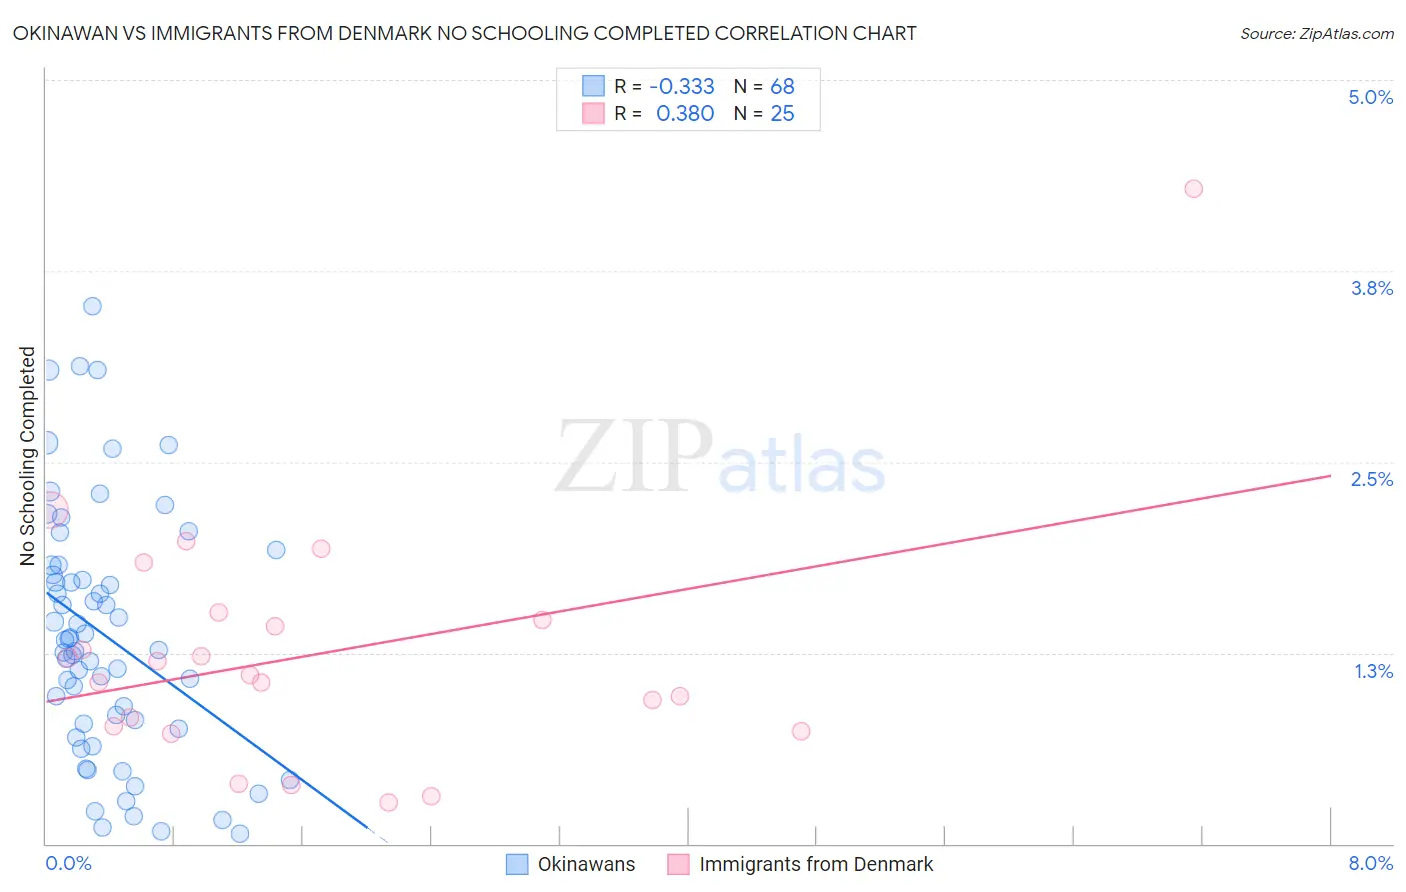
Okinawan vs Immigrants from Denmark No Schooling Completed Correlation Chart
The statistical analysis conducted on geographies consisting of 73,597,304 people shows a mild negative correlation between the proportion of Okinawans and percentage of population with no schooling in the United States with a correlation coefficient (R) of -0.333 and weighted average of 1.8%. Similarly, the statistical analysis conducted on geographies consisting of 135,590,094 people shows a mild positive correlation between the proportion of Immigrants from Denmark and percentage of population with no schooling in the United States with a correlation coefficient (R) of 0.380 and weighted average of 1.7%, a difference of 5.5%.
No Schooling Completed Correlation Summary
| Measurement | Okinawan | Immigrants from Denmark |
| Minimum | 0.067% | 0.27% |
| Maximum | 3.5% | 4.3% |
| Range | 3.5% | 4.0% |
| Mean | 1.4% | 1.2% |
| Median | 1.3% | 1.1% |
| Interquartile 25% (IQ1) | 0.77% | 0.75% |
| Interquartile 75% (IQ3) | 1.8% | 1.5% |
| Interquartile Range (IQR) | 1.0% | 0.74% |
| Standard Deviation (Sample) | 0.81% | 0.82% |
| Standard Deviation (Population) | 0.80% | 0.80% |
Similar Demographics by No Schooling Completed
Demographics Similar to Okinawans by No Schooling Completed
In terms of no schooling completed, the demographic groups most similar to Okinawans are Yugoslavian (1.8%, a difference of 0.22%), Immigrants from France (1.8%, a difference of 0.26%), Immigrants from Saudi Arabia (1.9%, a difference of 0.35%), Immigrants from Latvia (1.9%, a difference of 0.48%), and Immigrants from Japan (1.9%, a difference of 0.63%).
| Demographics | Rating | Rank | No Schooling Completed |
| Immigrants | Czechoslovakia | 97.9 /100 | #101 | Exceptional 1.8% |
| Immigrants | Switzerland | 97.9 /100 | #102 | Exceptional 1.8% |
| Basques | 97.9 /100 | #103 | Exceptional 1.8% |
| Thais | 97.5 /100 | #104 | Exceptional 1.8% |
| German Russians | 97.5 /100 | #105 | Exceptional 1.8% |
| Immigrants | France | 97.3 /100 | #106 | Exceptional 1.8% |
| Yugoslavians | 97.2 /100 | #107 | Exceptional 1.8% |
| Okinawans | 97.1 /100 | #108 | Exceptional 1.8% |
| Immigrants | Saudi Arabia | 96.8 /100 | #109 | Exceptional 1.9% |
| Immigrants | Latvia | 96.7 /100 | #110 | Exceptional 1.9% |
| Immigrants | Japan | 96.6 /100 | #111 | Exceptional 1.9% |
| Pueblo | 96.4 /100 | #112 | Exceptional 1.9% |
| Immigrants | Zimbabwe | 96.2 /100 | #113 | Exceptional 1.9% |
| Immigrants | Norway | 96.1 /100 | #114 | Exceptional 1.9% |
| Syrians | 96.0 /100 | #115 | Exceptional 1.9% |
Demographics Similar to Immigrants from Denmark by No Schooling Completed
In terms of no schooling completed, the demographic groups most similar to Immigrants from Denmark are Immigrants from Australia (1.7%, a difference of 0.040%), Potawatomi (1.7%, a difference of 0.050%), Ukrainian (1.8%, a difference of 0.090%), Immigrants from South Africa (1.7%, a difference of 0.16%), and Icelander (1.7%, a difference of 0.25%).
| Demographics | Rating | Rank | No Schooling Completed |
| Immigrants | Sweden | 99.3 /100 | #77 | Exceptional 1.7% |
| Delaware | 99.3 /100 | #78 | Exceptional 1.7% |
| Macedonians | 99.3 /100 | #79 | Exceptional 1.7% |
| Cypriots | 99.3 /100 | #80 | Exceptional 1.7% |
| Icelanders | 99.3 /100 | #81 | Exceptional 1.7% |
| Immigrants | South Africa | 99.3 /100 | #82 | Exceptional 1.7% |
| Potawatomi | 99.3 /100 | #83 | Exceptional 1.7% |
| Immigrants | Denmark | 99.2 /100 | #84 | Exceptional 1.7% |
| Immigrants | Australia | 99.2 /100 | #85 | Exceptional 1.7% |
| Ukrainians | 99.2 /100 | #86 | Exceptional 1.8% |
| Osage | 99.2 /100 | #87 | Exceptional 1.8% |
| Immigrants | Western Europe | 99.2 /100 | #88 | Exceptional 1.8% |
| South Africans | 99.1 /100 | #89 | Exceptional 1.8% |
| Sioux | 99.0 /100 | #90 | Exceptional 1.8% |
| Immigrants | Germany | 99.0 /100 | #91 | Exceptional 1.8% |