Dominican vs Immigrants from Cameroon Disability Age Over 75
COMPARE
Dominican
Immigrants from Cameroon
Disability Age Over 75
Disability Age Over 75 Comparison
Dominicans
Immigrants from Cameroon
50.2%
DISABILITY AGE OVER 75
0.0/ 100
METRIC RATING
301st/ 347
METRIC RANK
46.4%
DISABILITY AGE OVER 75
96.9/ 100
METRIC RATING
105th/ 347
METRIC RANK
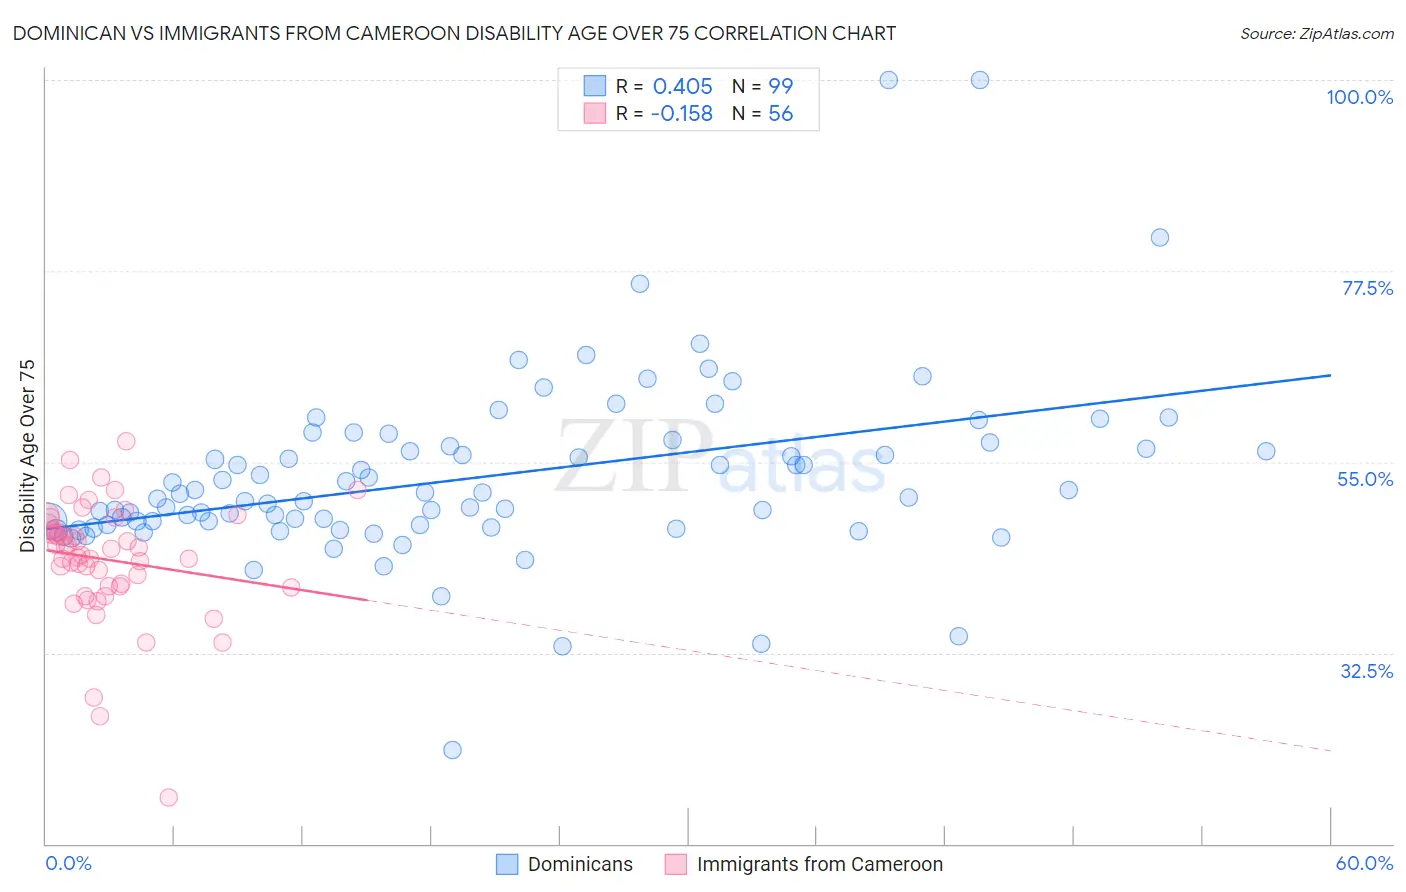
Dominican vs Immigrants from Cameroon Disability Age Over 75 Correlation Chart
The statistical analysis conducted on geographies consisting of 354,096,183 people shows a moderate positive correlation between the proportion of Dominicans and percentage of population with a disability over the age of 75 in the United States with a correlation coefficient (R) of 0.405 and weighted average of 50.2%. Similarly, the statistical analysis conducted on geographies consisting of 130,611,949 people shows a poor negative correlation between the proportion of Immigrants from Cameroon and percentage of population with a disability over the age of 75 in the United States with a correlation coefficient (R) of -0.158 and weighted average of 46.4%, a difference of 8.0%.
Disability Age Over 75 Correlation Summary
| Measurement | Dominican | Immigrants from Cameroon |
| Minimum | 21.0% | 15.5% |
| Maximum | 100.0% | 57.5% |
| Range | 79.0% | 42.0% |
| Mean | 53.2% | 43.5% |
| Median | 50.8% | 44.4% |
| Interquartile 25% (IQ1) | 47.6% | 40.3% |
| Interquartile 75% (IQ3) | 56.8% | 47.3% |
| Interquartile Range (IQR) | 9.2% | 7.0% |
| Standard Deviation (Sample) | 10.8% | 7.1% |
| Standard Deviation (Population) | 10.8% | 7.0% |
Similar Demographics by Disability Age Over 75
Demographics Similar to Dominicans by Disability Age Over 75
In terms of disability age over 75, the demographic groups most similar to Dominicans are Cape Verdean (50.1%, a difference of 0.060%), Immigrants from Micronesia (50.1%, a difference of 0.090%), Cherokee (50.2%, a difference of 0.15%), Marshallese (50.1%, a difference of 0.16%), and Japanese (50.2%, a difference of 0.17%).
| Demographics | Rating | Rank | Disability Age Over 75 |
| Immigrants | Cambodia | 0.0 /100 | #294 | Tragic 50.0% |
| Spanish Americans | 0.0 /100 | #295 | Tragic 50.0% |
| Mexican American Indians | 0.0 /100 | #296 | Tragic 50.0% |
| Armenians | 0.0 /100 | #297 | Tragic 50.0% |
| Marshallese | 0.0 /100 | #298 | Tragic 50.1% |
| Immigrants | Micronesia | 0.0 /100 | #299 | Tragic 50.1% |
| Cape Verdeans | 0.0 /100 | #300 | Tragic 50.1% |
| Dominicans | 0.0 /100 | #301 | Tragic 50.2% |
| Cherokee | 0.0 /100 | #302 | Tragic 50.2% |
| Japanese | 0.0 /100 | #303 | Tragic 50.2% |
| Immigrants | Dominican Republic | 0.0 /100 | #304 | Tragic 50.3% |
| Central American Indians | 0.0 /100 | #305 | Tragic 50.5% |
| Immigrants | Central America | 0.0 /100 | #306 | Tragic 50.5% |
| Immigrants | Fiji | 0.0 /100 | #307 | Tragic 50.6% |
| Hispanics or Latinos | 0.0 /100 | #308 | Tragic 50.6% |
Demographics Similar to Immigrants from Cameroon by Disability Age Over 75
In terms of disability age over 75, the demographic groups most similar to Immigrants from Cameroon are Immigrants from Kuwait (46.4%, a difference of 0.010%), Israeli (46.4%, a difference of 0.020%), Ukrainian (46.4%, a difference of 0.040%), Immigrants from Malaysia (46.4%, a difference of 0.050%), and Immigrants from Uruguay (46.4%, a difference of 0.050%).
| Demographics | Rating | Rank | Disability Age Over 75 |
| Immigrants | Japan | 97.8 /100 | #98 | Exceptional 46.3% |
| Palestinians | 97.7 /100 | #99 | Exceptional 46.3% |
| Immigrants | Eastern Europe | 97.7 /100 | #100 | Exceptional 46.3% |
| Mongolians | 97.7 /100 | #101 | Exceptional 46.3% |
| Immigrants | Malaysia | 97.1 /100 | #102 | Exceptional 46.4% |
| Ukrainians | 97.1 /100 | #103 | Exceptional 46.4% |
| Israelis | 97.0 /100 | #104 | Exceptional 46.4% |
| Immigrants | Cameroon | 96.9 /100 | #105 | Exceptional 46.4% |
| Immigrants | Kuwait | 96.8 /100 | #106 | Exceptional 46.4% |
| Immigrants | Uruguay | 96.7 /100 | #107 | Exceptional 46.4% |
| Brazilians | 96.6 /100 | #108 | Exceptional 46.5% |
| Chileans | 96.4 /100 | #109 | Exceptional 46.5% |
| Immigrants | Hong Kong | 96.4 /100 | #110 | Exceptional 46.5% |
| Immigrants | Chile | 96.4 /100 | #111 | Exceptional 46.5% |
| Immigrants | Pakistan | 96.1 /100 | #112 | Exceptional 46.5% |