Delaware vs Immigrants from Norway GED/Equivalency
COMPARE
Delaware
Immigrants from Norway
GED/Equivalency
GED/Equivalency Comparison
Delaware
Immigrants from Norway
85.2%
GED/EQUIVALENCY
22.2/ 100
METRIC RATING
193rd/ 347
METRIC RANK
87.5%
GED/EQUIVALENCY
98.1/ 100
METRIC RATING
88th/ 347
METRIC RANK
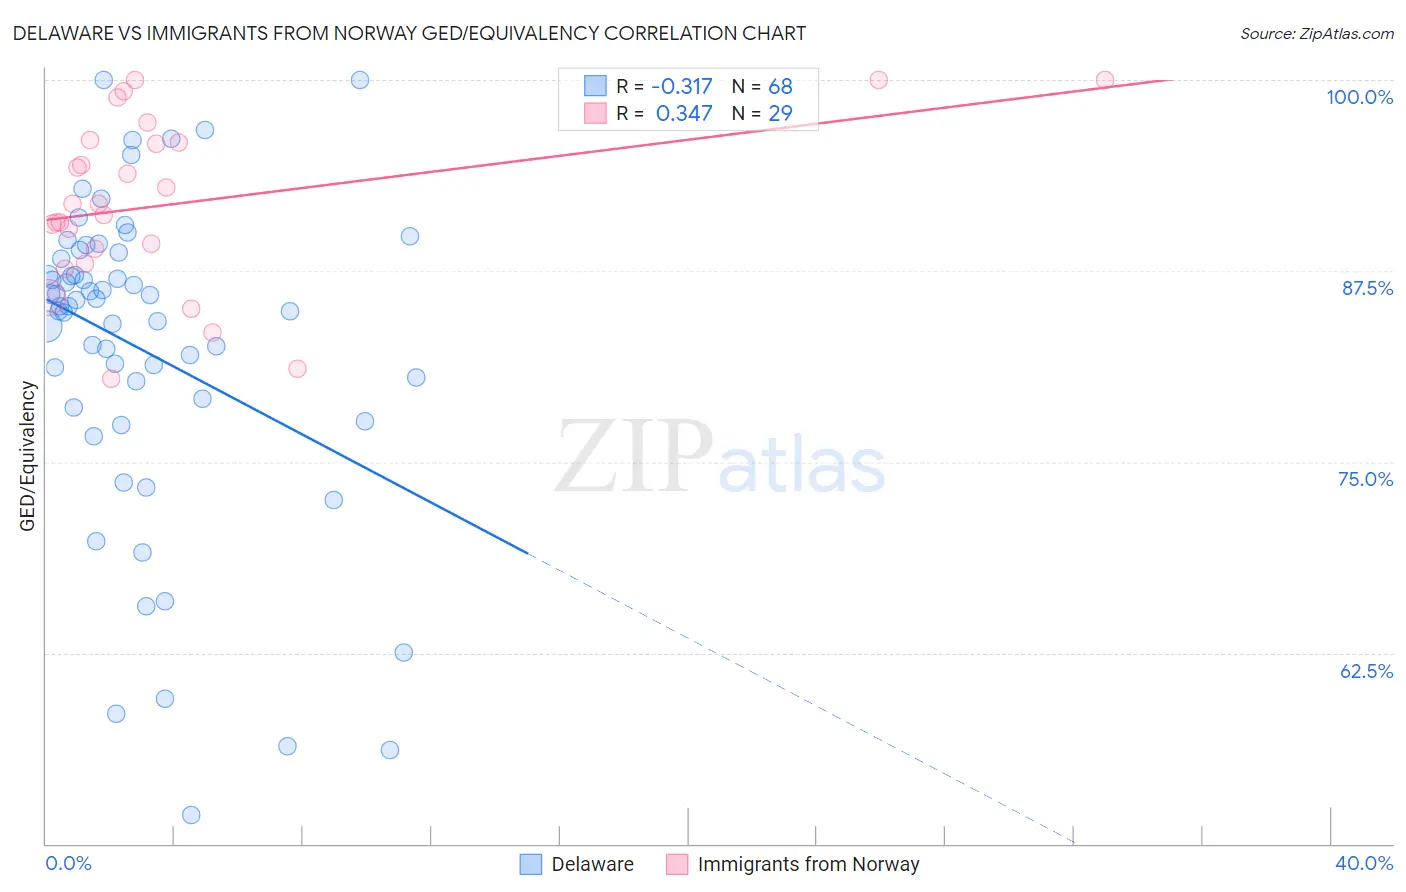
Delaware vs Immigrants from Norway GED/Equivalency Correlation Chart
The statistical analysis conducted on geographies consisting of 96,235,398 people shows a mild negative correlation between the proportion of Delaware and percentage of population with at least ged/equivalency education in the United States with a correlation coefficient (R) of -0.317 and weighted average of 85.2%. Similarly, the statistical analysis conducted on geographies consisting of 116,716,420 people shows a mild positive correlation between the proportion of Immigrants from Norway and percentage of population with at least ged/equivalency education in the United States with a correlation coefficient (R) of 0.347 and weighted average of 87.5%, a difference of 2.7%.
GED/Equivalency Correlation Summary
| Measurement | Delaware | Immigrants from Norway |
| Minimum | 51.9% | 80.4% |
| Maximum | 100.0% | 100.0% |
| Range | 48.1% | 19.6% |
| Mean | 82.3% | 91.9% |
| Median | 85.2% | 91.9% |
| Interquartile 25% (IQ1) | 78.8% | 88.5% |
| Interquartile 75% (IQ3) | 88.5% | 96.0% |
| Interquartile Range (IQR) | 9.7% | 7.6% |
| Standard Deviation (Sample) | 10.5% | 5.5% |
| Standard Deviation (Population) | 10.5% | 5.4% |
Similar Demographics by GED/Equivalency
Demographics Similar to Delaware by GED/Equivalency
In terms of ged/equivalency, the demographic groups most similar to Delaware are Nonimmigrants (85.2%, a difference of 0.010%), South American Indian (85.2%, a difference of 0.020%), Puget Sound Salish (85.2%, a difference of 0.040%), Chippewa (85.2%, a difference of 0.040%), and Tongan (85.2%, a difference of 0.050%).
| Demographics | Rating | Rank | GED/Equivalency |
| Spaniards | 31.9 /100 | #186 | Fair 85.4% |
| Immigrants | Afghanistan | 29.8 /100 | #187 | Fair 85.4% |
| Immigrants | Sierra Leone | 29.0 /100 | #188 | Fair 85.4% |
| Guamanians/Chamorros | 28.4 /100 | #189 | Fair 85.3% |
| Alaskan Athabascans | 27.5 /100 | #190 | Fair 85.3% |
| South American Indians | 22.8 /100 | #191 | Fair 85.2% |
| Immigrants | Nonimmigrants | 22.7 /100 | #192 | Fair 85.2% |
| Delaware | 22.2 /100 | #193 | Fair 85.2% |
| Puget Sound Salish | 20.8 /100 | #194 | Fair 85.2% |
| Chippewa | 20.8 /100 | #195 | Fair 85.2% |
| Tongans | 20.7 /100 | #196 | Fair 85.2% |
| Costa Ricans | 20.4 /100 | #197 | Fair 85.2% |
| Immigrants | Africa | 17.5 /100 | #198 | Poor 85.1% |
| Somalis | 16.4 /100 | #199 | Poor 85.0% |
| Uruguayans | 16.0 /100 | #200 | Poor 85.0% |
Demographics Similar to Immigrants from Norway by GED/Equivalency
In terms of ged/equivalency, the demographic groups most similar to Immigrants from Norway are Immigrants from Europe (87.5%, a difference of 0.010%), Native Hawaiian (87.5%, a difference of 0.010%), Immigrants from Romania (87.5%, a difference of 0.020%), Dutch (87.5%, a difference of 0.020%), and Hungarian (87.4%, a difference of 0.040%).
| Demographics | Rating | Rank | GED/Equivalency |
| Immigrants | Sri Lanka | 98.3 /100 | #81 | Exceptional 87.5% |
| Romanians | 98.3 /100 | #82 | Exceptional 87.5% |
| South Africans | 98.3 /100 | #83 | Exceptional 87.5% |
| Immigrants | Romania | 98.1 /100 | #84 | Exceptional 87.5% |
| Dutch | 98.1 /100 | #85 | Exceptional 87.5% |
| Immigrants | Europe | 98.1 /100 | #86 | Exceptional 87.5% |
| Native Hawaiians | 98.1 /100 | #87 | Exceptional 87.5% |
| Immigrants | Norway | 98.1 /100 | #88 | Exceptional 87.5% |
| Hungarians | 97.9 /100 | #89 | Exceptional 87.4% |
| Welsh | 97.9 /100 | #90 | Exceptional 87.4% |
| Immigrants | Eastern Asia | 97.9 /100 | #91 | Exceptional 87.4% |
| Israelis | 97.8 /100 | #92 | Exceptional 87.4% |
| Immigrants | North Macedonia | 97.8 /100 | #93 | Exceptional 87.4% |
| Immigrants | Russia | 97.8 /100 | #94 | Exceptional 87.4% |
| Immigrants | Greece | 97.7 /100 | #95 | Exceptional 87.4% |