Dutch vs Immigrants from Norway GED/Equivalency
COMPARE
Dutch
Immigrants from Norway
GED/Equivalency
GED/Equivalency Comparison
Dutch
Immigrants from Norway
87.5%
GED/EQUIVALENCY
98.1/ 100
METRIC RATING
85th/ 347
METRIC RANK
87.5%
GED/EQUIVALENCY
98.1/ 100
METRIC RATING
88th/ 347
METRIC RANK
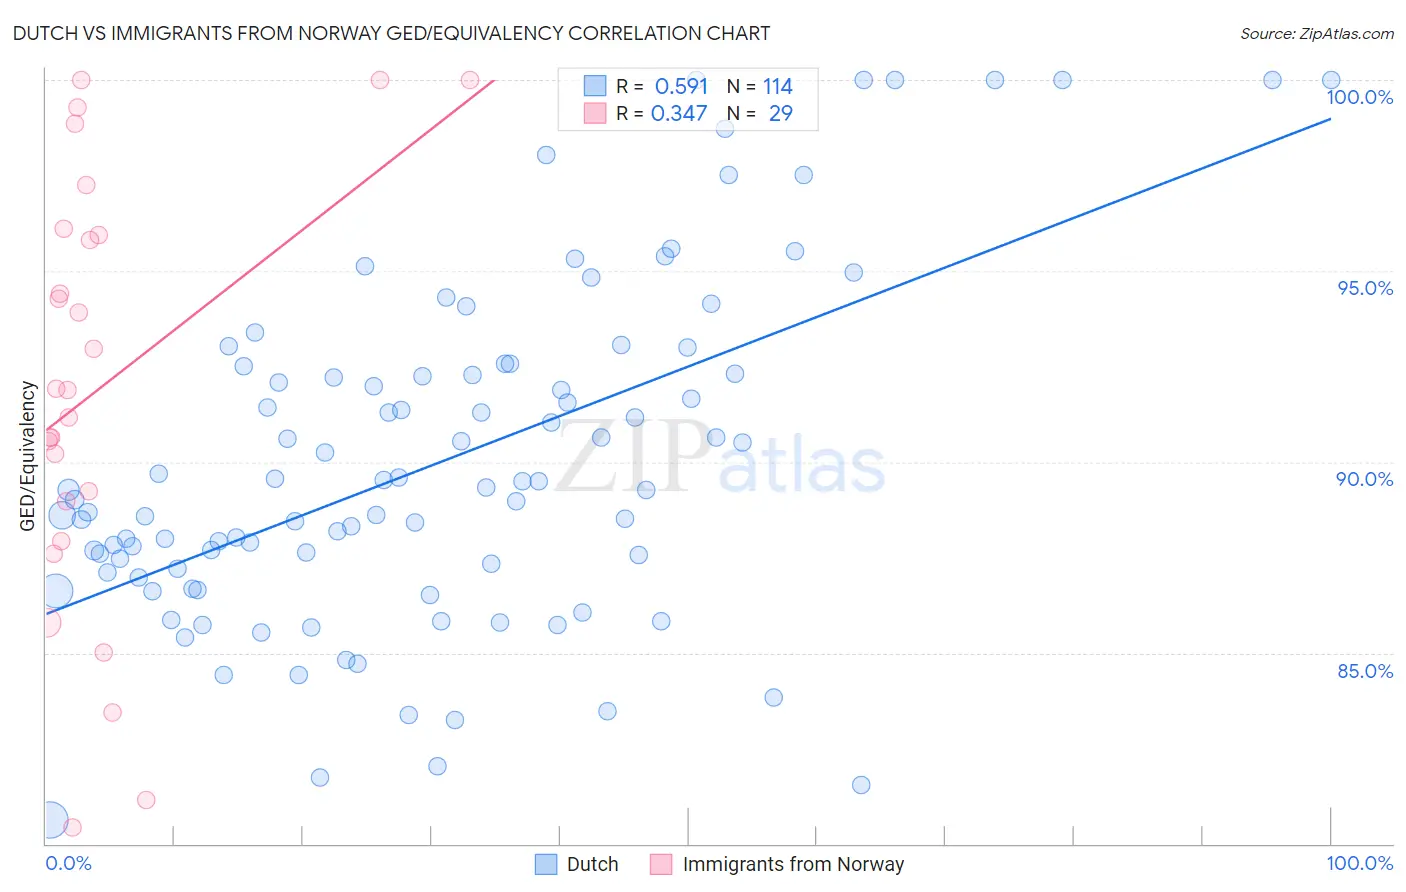
Dutch vs Immigrants from Norway GED/Equivalency Correlation Chart
The statistical analysis conducted on geographies consisting of 554,358,380 people shows a substantial positive correlation between the proportion of Dutch and percentage of population with at least ged/equivalency education in the United States with a correlation coefficient (R) of 0.591 and weighted average of 87.5%. Similarly, the statistical analysis conducted on geographies consisting of 116,716,420 people shows a mild positive correlation between the proportion of Immigrants from Norway and percentage of population with at least ged/equivalency education in the United States with a correlation coefficient (R) of 0.347 and weighted average of 87.5%, a difference of 0.020%.
GED/Equivalency Correlation Summary
| Measurement | Dutch | Immigrants from Norway |
| Minimum | 80.6% | 80.4% |
| Maximum | 100.0% | 100.0% |
| Range | 19.4% | 19.6% |
| Mean | 90.0% | 91.9% |
| Median | 89.3% | 91.9% |
| Interquartile 25% (IQ1) | 87.1% | 88.5% |
| Interquartile 75% (IQ3) | 92.3% | 96.0% |
| Interquartile Range (IQR) | 5.2% | 7.6% |
| Standard Deviation (Sample) | 4.5% | 5.5% |
| Standard Deviation (Population) | 4.4% | 5.4% |
Demographics Similar to Dutch and Immigrants from Norway by GED/Equivalency
In terms of ged/equivalency, the demographic groups most similar to Dutch are Immigrants from Romania (87.5%, a difference of 0.0%), Immigrants from Europe (87.5%, a difference of 0.010%), Native Hawaiian (87.5%, a difference of 0.010%), South African (87.5%, a difference of 0.040%), and Immigrants from Sri Lanka (87.5%, a difference of 0.050%). Similarly, the demographic groups most similar to Immigrants from Norway are Immigrants from Europe (87.5%, a difference of 0.010%), Native Hawaiian (87.5%, a difference of 0.010%), Immigrants from Romania (87.5%, a difference of 0.020%), Hungarian (87.4%, a difference of 0.040%), and Welsh (87.4%, a difference of 0.040%).
| Demographics | Rating | Rank | GED/Equivalency |
| Immigrants | Serbia | 98.7 /100 | #76 | Exceptional 87.7% |
| Slavs | 98.7 /100 | #77 | Exceptional 87.7% |
| Irish | 98.6 /100 | #78 | Exceptional 87.6% |
| English | 98.6 /100 | #79 | Exceptional 87.6% |
| Immigrants | England | 98.5 /100 | #80 | Exceptional 87.6% |
| Immigrants | Sri Lanka | 98.3 /100 | #81 | Exceptional 87.5% |
| Romanians | 98.3 /100 | #82 | Exceptional 87.5% |
| South Africans | 98.3 /100 | #83 | Exceptional 87.5% |
| Immigrants | Romania | 98.1 /100 | #84 | Exceptional 87.5% |
| Dutch | 98.1 /100 | #85 | Exceptional 87.5% |
| Immigrants | Europe | 98.1 /100 | #86 | Exceptional 87.5% |
| Native Hawaiians | 98.1 /100 | #87 | Exceptional 87.5% |
| Immigrants | Norway | 98.1 /100 | #88 | Exceptional 87.5% |
| Hungarians | 97.9 /100 | #89 | Exceptional 87.4% |
| Welsh | 97.9 /100 | #90 | Exceptional 87.4% |
| Immigrants | Eastern Asia | 97.9 /100 | #91 | Exceptional 87.4% |
| Israelis | 97.8 /100 | #92 | Exceptional 87.4% |
| Immigrants | North Macedonia | 97.8 /100 | #93 | Exceptional 87.4% |
| Immigrants | Russia | 97.8 /100 | #94 | Exceptional 87.4% |
| Immigrants | Greece | 97.7 /100 | #95 | Exceptional 87.4% |
| Czechoslovakians | 97.6 /100 | #96 | Exceptional 87.4% |