Delaware vs Iraqi College, Under 1 year
COMPARE
Delaware
Iraqi
College, Under 1 year
College, Under 1 year Comparison
Delaware
Iraqis
62.1%
COLLEGE, UNDER 1 YEAR
0.9/ 100
METRIC RATING
245th/ 347
METRIC RANK
66.8%
COLLEGE, UNDER 1 YEAR
88.0/ 100
METRIC RATING
134th/ 347
METRIC RANK
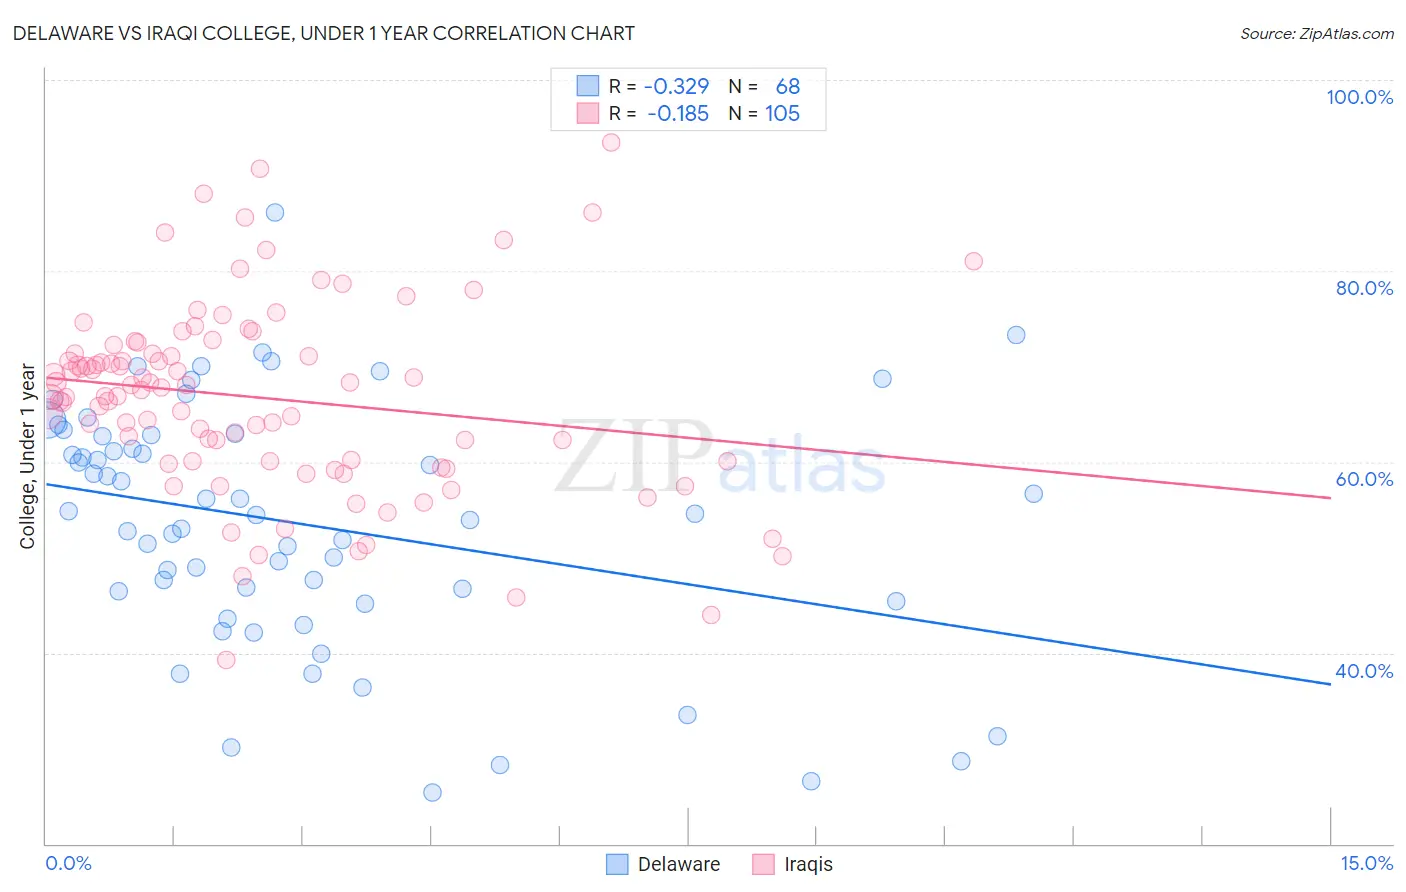
Delaware vs Iraqi College, Under 1 year Correlation Chart
The statistical analysis conducted on geographies consisting of 96,235,398 people shows a mild negative correlation between the proportion of Delaware and percentage of population with at least college, under 1 year education in the United States with a correlation coefficient (R) of -0.329 and weighted average of 62.1%. Similarly, the statistical analysis conducted on geographies consisting of 170,646,754 people shows a poor negative correlation between the proportion of Iraqis and percentage of population with at least college, under 1 year education in the United States with a correlation coefficient (R) of -0.185 and weighted average of 66.8%, a difference of 7.7%.
College, Under 1 year Correlation Summary
| Measurement | Delaware | Iraqi |
| Minimum | 25.3% | 39.2% |
| Maximum | 86.2% | 93.4% |
| Range | 60.9% | 54.2% |
| Mean | 53.5% | 66.7% |
| Median | 54.5% | 67.6% |
| Interquartile 25% (IQ1) | 45.9% | 60.1% |
| Interquartile 75% (IQ3) | 62.7% | 71.8% |
| Interquartile Range (IQR) | 16.8% | 11.7% |
| Standard Deviation (Sample) | 12.8% | 10.0% |
| Standard Deviation (Population) | 12.7% | 9.9% |
Similar Demographics by College, Under 1 year
Demographics Similar to Delaware by College, Under 1 year
In terms of college, under 1 year, the demographic groups most similar to Delaware are Colville (62.1%, a difference of 0.060%), Hawaiian (62.1%, a difference of 0.15%), Malaysian (62.2%, a difference of 0.18%), Marshallese (61.9%, a difference of 0.22%), and Ottawa (62.2%, a difference of 0.23%).
| Demographics | Rating | Rank | College, Under 1 year |
| French American Indians | 1.5 /100 | #238 | Tragic 62.4% |
| Nepalese | 1.1 /100 | #239 | Tragic 62.2% |
| Aleuts | 1.1 /100 | #240 | Tragic 62.2% |
| Ottawa | 1.1 /100 | #241 | Tragic 62.2% |
| Malaysians | 1.1 /100 | #242 | Tragic 62.2% |
| Hawaiians | 1.1 /100 | #243 | Tragic 62.1% |
| Colville | 1.0 /100 | #244 | Tragic 62.1% |
| Delaware | 0.9 /100 | #245 | Tragic 62.1% |
| Marshallese | 0.8 /100 | #246 | Tragic 61.9% |
| Immigrants | Liberia | 0.8 /100 | #247 | Tragic 61.9% |
| Potawatomi | 0.6 /100 | #248 | Tragic 61.8% |
| Vietnamese | 0.5 /100 | #249 | Tragic 61.7% |
| Immigrants | Congo | 0.5 /100 | #250 | Tragic 61.7% |
| Immigrants | Micronesia | 0.5 /100 | #251 | Tragic 61.5% |
| West Indians | 0.4 /100 | #252 | Tragic 61.5% |
Demographics Similar to Iraqis by College, Under 1 year
In terms of college, under 1 year, the demographic groups most similar to Iraqis are Canadian (66.8%, a difference of 0.010%), Ugandan (66.8%, a difference of 0.020%), Immigrants from Brazil (66.9%, a difference of 0.030%), Polish (66.9%, a difference of 0.050%), and Finnish (66.9%, a difference of 0.060%).
| Demographics | Rating | Rank | College, Under 1 year |
| Czechs | 90.8 /100 | #127 | Exceptional 67.1% |
| Scottish | 90.2 /100 | #128 | Exceptional 67.0% |
| Immigrants | Eastern Africa | 89.5 /100 | #129 | Excellent 67.0% |
| Immigrants | Syria | 89.0 /100 | #130 | Excellent 66.9% |
| Finns | 88.6 /100 | #131 | Excellent 66.9% |
| Poles | 88.4 /100 | #132 | Excellent 66.9% |
| Immigrants | Brazil | 88.3 /100 | #133 | Excellent 66.9% |
| Iraqis | 88.0 /100 | #134 | Excellent 66.8% |
| Canadians | 87.9 /100 | #135 | Excellent 66.8% |
| Ugandans | 87.8 /100 | #136 | Excellent 66.8% |
| Immigrants | Chile | 87.4 /100 | #137 | Excellent 66.8% |
| Immigrants | Italy | 86.9 /100 | #138 | Excellent 66.8% |
| Venezuelans | 85.9 /100 | #139 | Excellent 66.7% |
| Slavs | 85.9 /100 | #140 | Excellent 66.7% |
| Immigrants | Afghanistan | 85.1 /100 | #141 | Excellent 66.7% |