Czech vs Spanish American Family Households with Children
COMPARE
Czech
Spanish American
Family Households with Children
Family Households with Children Comparison
Czechs
Spanish Americans
27.5%
FAMILY HOUSEHOLDS WITH CHILDREN
65.3/ 100
METRIC RATING
163rd/ 347
METRIC RANK
27.4%
FAMILY HOUSEHOLDS WITH CHILDREN
48.9/ 100
METRIC RATING
178th/ 347
METRIC RANK
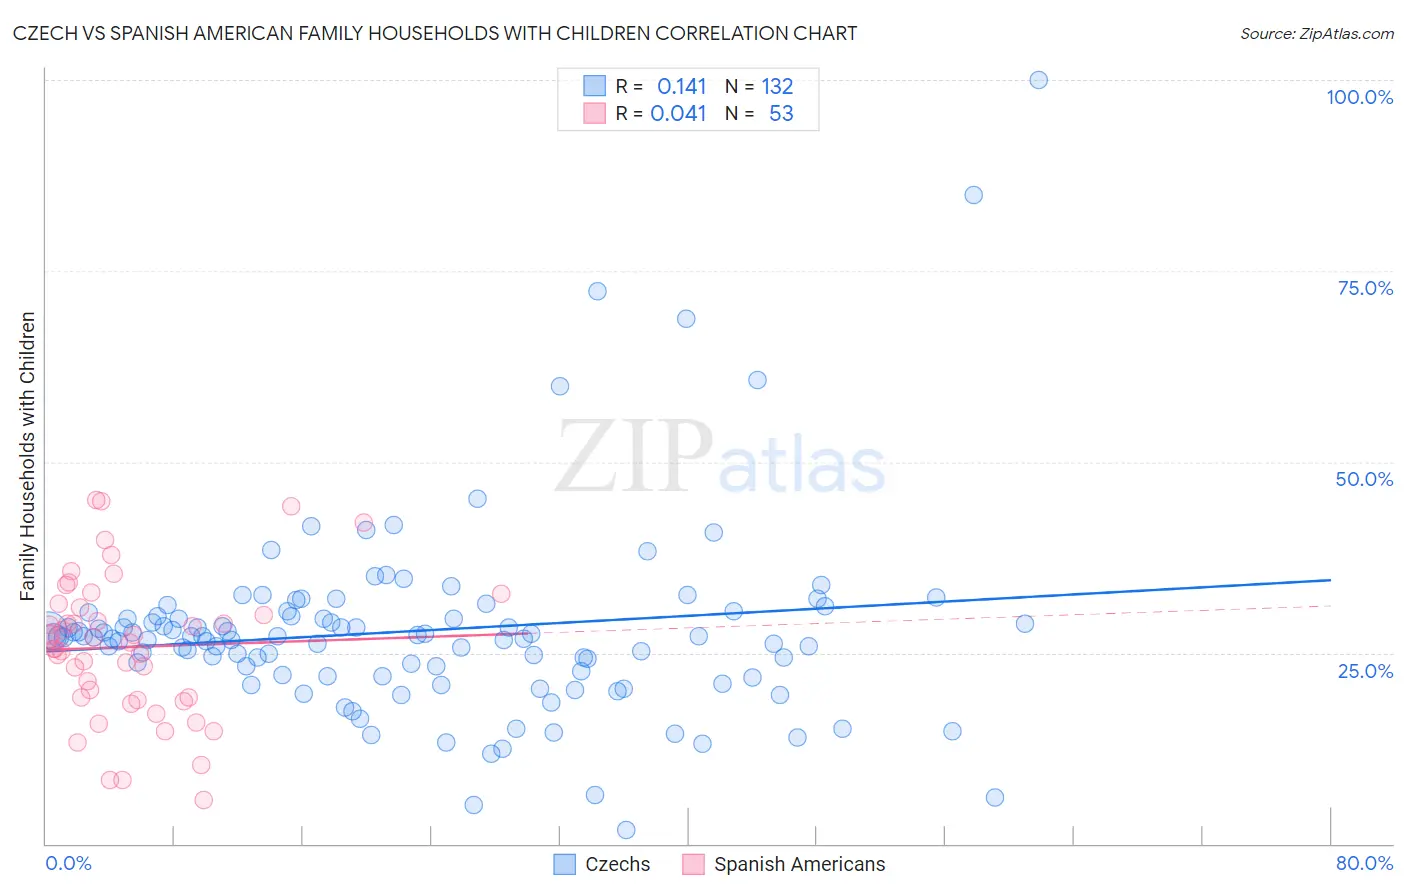
Czech vs Spanish American Family Households with Children Correlation Chart
The statistical analysis conducted on geographies consisting of 484,223,997 people shows a poor positive correlation between the proportion of Czechs and percentage of family households with children in the United States with a correlation coefficient (R) of 0.141 and weighted average of 27.5%. Similarly, the statistical analysis conducted on geographies consisting of 103,165,660 people shows no correlation between the proportion of Spanish Americans and percentage of family households with children in the United States with a correlation coefficient (R) of 0.041 and weighted average of 27.4%, a difference of 0.37%.
Family Households with Children Correlation Summary
| Measurement | Czech | Spanish American |
| Minimum | 1.9% | 5.7% |
| Maximum | 100.0% | 45.1% |
| Range | 98.1% | 39.4% |
| Mean | 27.9% | 25.8% |
| Median | 27.1% | 26.3% |
| Interquartile 25% (IQ1) | 22.3% | 19.0% |
| Interquartile 75% (IQ3) | 29.8% | 31.1% |
| Interquartile Range (IQR) | 7.4% | 12.1% |
| Standard Deviation (Sample) | 12.9% | 9.3% |
| Standard Deviation (Population) | 12.8% | 9.2% |
Demographics Similar to Czechs and Spanish Americans by Family Households with Children
In terms of family households with children, the demographic groups most similar to Czechs are Immigrants from Hong Kong (27.5%, a difference of 0.010%), Alaskan Athabascan (27.6%, a difference of 0.040%), Immigrants from Bangladesh (27.6%, a difference of 0.040%), Subsaharan African (27.6%, a difference of 0.050%), and Immigrants from South Africa (27.5%, a difference of 0.090%). Similarly, the demographic groups most similar to Spanish Americans are Ugandan (27.4%, a difference of 0.010%), White/Caucasian (27.4%, a difference of 0.020%), British (27.4%, a difference of 0.020%), Immigrants from China (27.4%, a difference of 0.020%), and Turkish (27.4%, a difference of 0.040%).
| Demographics | Rating | Rank | Family Households with Children |
| Sub-Saharan Africans | 67.5 /100 | #160 | Good 27.6% |
| Alaskan Athabascans | 67.1 /100 | #161 | Good 27.6% |
| Immigrants | Bangladesh | 67.0 /100 | #162 | Good 27.6% |
| Czechs | 65.3 /100 | #163 | Good 27.5% |
| Immigrants | Hong Kong | 64.9 /100 | #164 | Good 27.5% |
| Immigrants | South Africa | 61.3 /100 | #165 | Good 27.5% |
| Immigrants | Nonimmigrants | 61.2 /100 | #166 | Good 27.5% |
| Dominicans | 61.1 /100 | #167 | Good 27.5% |
| Immigrants | Kuwait | 60.9 /100 | #168 | Good 27.5% |
| Seminole | 56.9 /100 | #169 | Average 27.5% |
| Cherokee | 56.7 /100 | #170 | Average 27.5% |
| Blackfeet | 54.3 /100 | #171 | Average 27.5% |
| Israelis | 53.9 /100 | #172 | Average 27.5% |
| Immigrants | Argentina | 52.2 /100 | #173 | Average 27.5% |
| Whites/Caucasians | 50.0 /100 | #174 | Average 27.4% |
| British | 49.9 /100 | #175 | Average 27.4% |
| Immigrants | China | 49.6 /100 | #176 | Average 27.4% |
| Ugandans | 49.2 /100 | #177 | Average 27.4% |
| Spanish Americans | 48.9 /100 | #178 | Average 27.4% |
| Turks | 46.9 /100 | #179 | Average 27.4% |
| Immigrants | Turkey | 46.9 /100 | #180 | Average 27.4% |