Immigrants from Western Asia vs Immigrants from Zaire No Schooling Completed
COMPARE
Immigrants from Western Asia
Immigrants from Zaire
No Schooling Completed
No Schooling Completed Comparison
Immigrants from Western Asia
Immigrants from Zaire
2.3%
NO SCHOOLING COMPLETED
2.6/ 100
METRIC RATING
235th/ 347
METRIC RANK
2.3%
NO SCHOOLING COMPLETED
7.2/ 100
METRIC RATING
215th/ 347
METRIC RANK
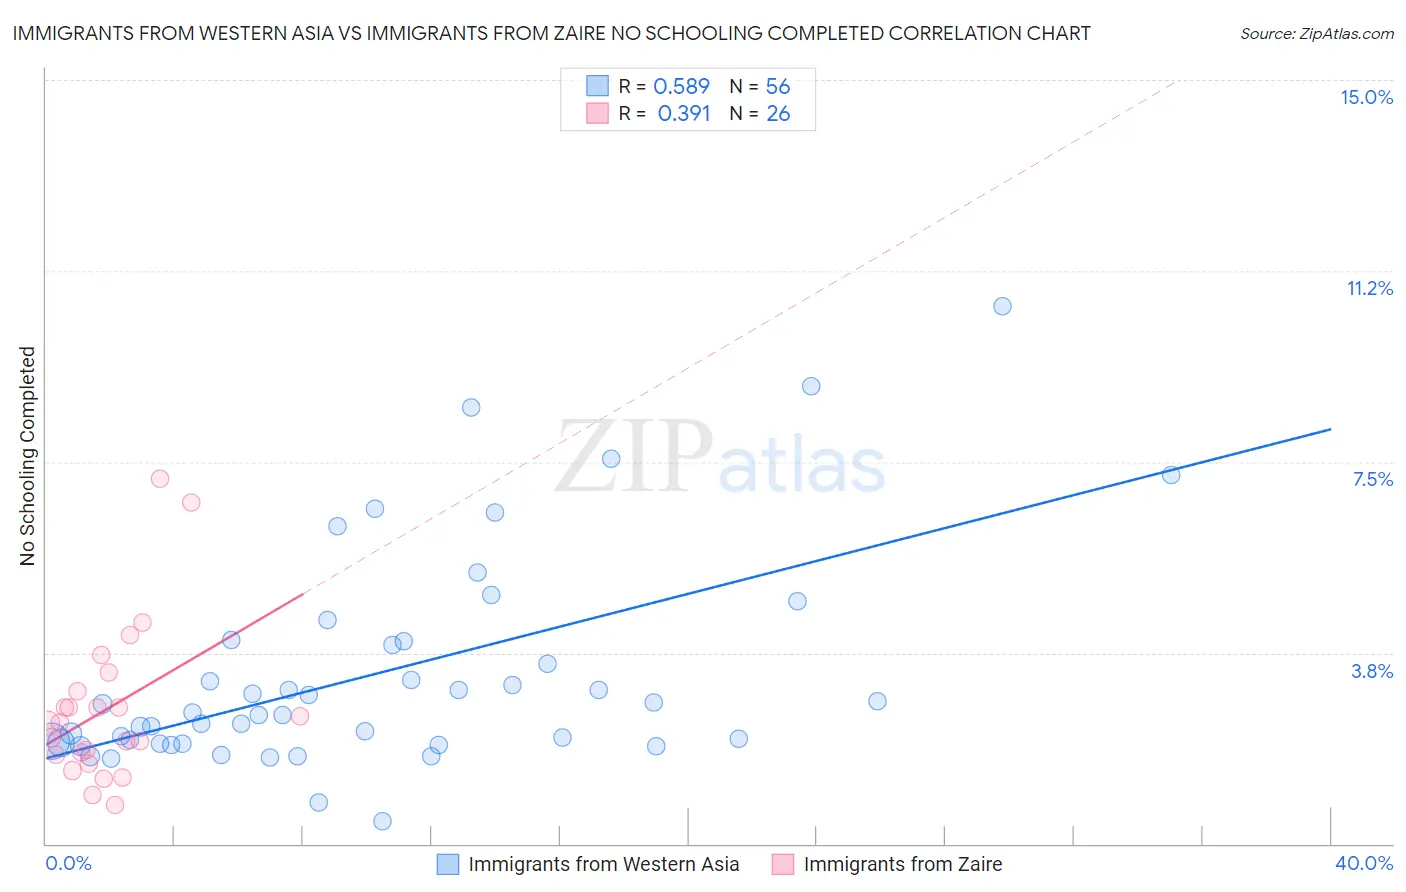
Immigrants from Western Asia vs Immigrants from Zaire No Schooling Completed Correlation Chart
The statistical analysis conducted on geographies consisting of 400,576,161 people shows a substantial positive correlation between the proportion of Immigrants from Western Asia and percentage of population with no schooling in the United States with a correlation coefficient (R) of 0.589 and weighted average of 2.3%. Similarly, the statistical analysis conducted on geographies consisting of 107,090,561 people shows a mild positive correlation between the proportion of Immigrants from Zaire and percentage of population with no schooling in the United States with a correlation coefficient (R) of 0.391 and weighted average of 2.3%, a difference of 3.3%.
No Schooling Completed Correlation Summary
| Measurement | Immigrants from Western Asia | Immigrants from Zaire |
| Minimum | 0.45% | 0.76% |
| Maximum | 10.6% | 7.2% |
| Range | 10.1% | 6.4% |
| Mean | 3.3% | 2.7% |
| Median | 2.5% | 2.4% |
| Interquartile 25% (IQ1) | 2.0% | 1.7% |
| Interquartile 75% (IQ3) | 3.9% | 3.0% |
| Interquartile Range (IQR) | 2.0% | 1.3% |
| Standard Deviation (Sample) | 2.1% | 1.5% |
| Standard Deviation (Population) | 2.1% | 1.5% |
Demographics Similar to Immigrants from Western Asia and Immigrants from Zaire by No Schooling Completed
In terms of no schooling completed, the demographic groups most similar to Immigrants from Western Asia are Nigerian (2.3%, a difference of 0.020%), Immigrants from Malaysia (2.3%, a difference of 0.27%), Colombian (2.3%, a difference of 0.62%), Immigrants from Uruguay (2.3%, a difference of 0.85%), and Puerto Rican (2.3%, a difference of 0.87%). Similarly, the demographic groups most similar to Immigrants from Zaire are Tongan (2.3%, a difference of 0.20%), Immigrants from Syria (2.3%, a difference of 0.28%), Immigrants from Nepal (2.3%, a difference of 0.39%), Senegalese (2.3%, a difference of 0.83%), and Immigrants from Costa Rica (2.3%, a difference of 1.1%).
| Demographics | Rating | Rank | No Schooling Completed |
| Immigrants | Zaire | 7.2 /100 | #215 | Tragic 2.3% |
| Tongans | 6.8 /100 | #216 | Tragic 2.3% |
| Immigrants | Syria | 6.6 /100 | #217 | Tragic 2.3% |
| Immigrants | Nepal | 6.4 /100 | #218 | Tragic 2.3% |
| Senegalese | 5.6 /100 | #219 | Tragic 2.3% |
| Immigrants | Costa Rica | 5.1 /100 | #220 | Tragic 2.3% |
| Immigrants | Sudan | 5.0 /100 | #221 | Tragic 2.3% |
| Sub-Saharan Africans | 4.7 /100 | #222 | Tragic 2.3% |
| Immigrants | Lebanon | 4.5 /100 | #223 | Tragic 2.3% |
| Tohono O'odham | 4.1 /100 | #224 | Tragic 2.3% |
| Sudanese | 4.1 /100 | #225 | Tragic 2.3% |
| Sierra Leoneans | 4.1 /100 | #226 | Tragic 2.3% |
| Immigrants | Uganda | 4.0 /100 | #227 | Tragic 2.3% |
| U.S. Virgin Islanders | 3.7 /100 | #228 | Tragic 2.3% |
| Immigrants | Pakistan | 3.6 /100 | #229 | Tragic 2.3% |
| Puerto Ricans | 3.4 /100 | #230 | Tragic 2.3% |
| Immigrants | Uruguay | 3.4 /100 | #231 | Tragic 2.3% |
| Colombians | 3.2 /100 | #232 | Tragic 2.3% |
| Immigrants | Malaysia | 2.8 /100 | #233 | Tragic 2.3% |
| Nigerians | 2.6 /100 | #234 | Tragic 2.3% |
| Immigrants | Western Asia | 2.6 /100 | #235 | Tragic 2.3% |