Immigrants from Southern Europe vs Immigrants from Zaire No Schooling Completed
COMPARE
Immigrants from Southern Europe
Immigrants from Zaire
No Schooling Completed
No Schooling Completed Comparison
Immigrants from Southern Europe
Immigrants from Zaire
2.2%
NO SCHOOLING COMPLETED
23.8/ 100
METRIC RATING
197th/ 347
METRIC RANK
2.3%
NO SCHOOLING COMPLETED
7.2/ 100
METRIC RATING
215th/ 347
METRIC RANK
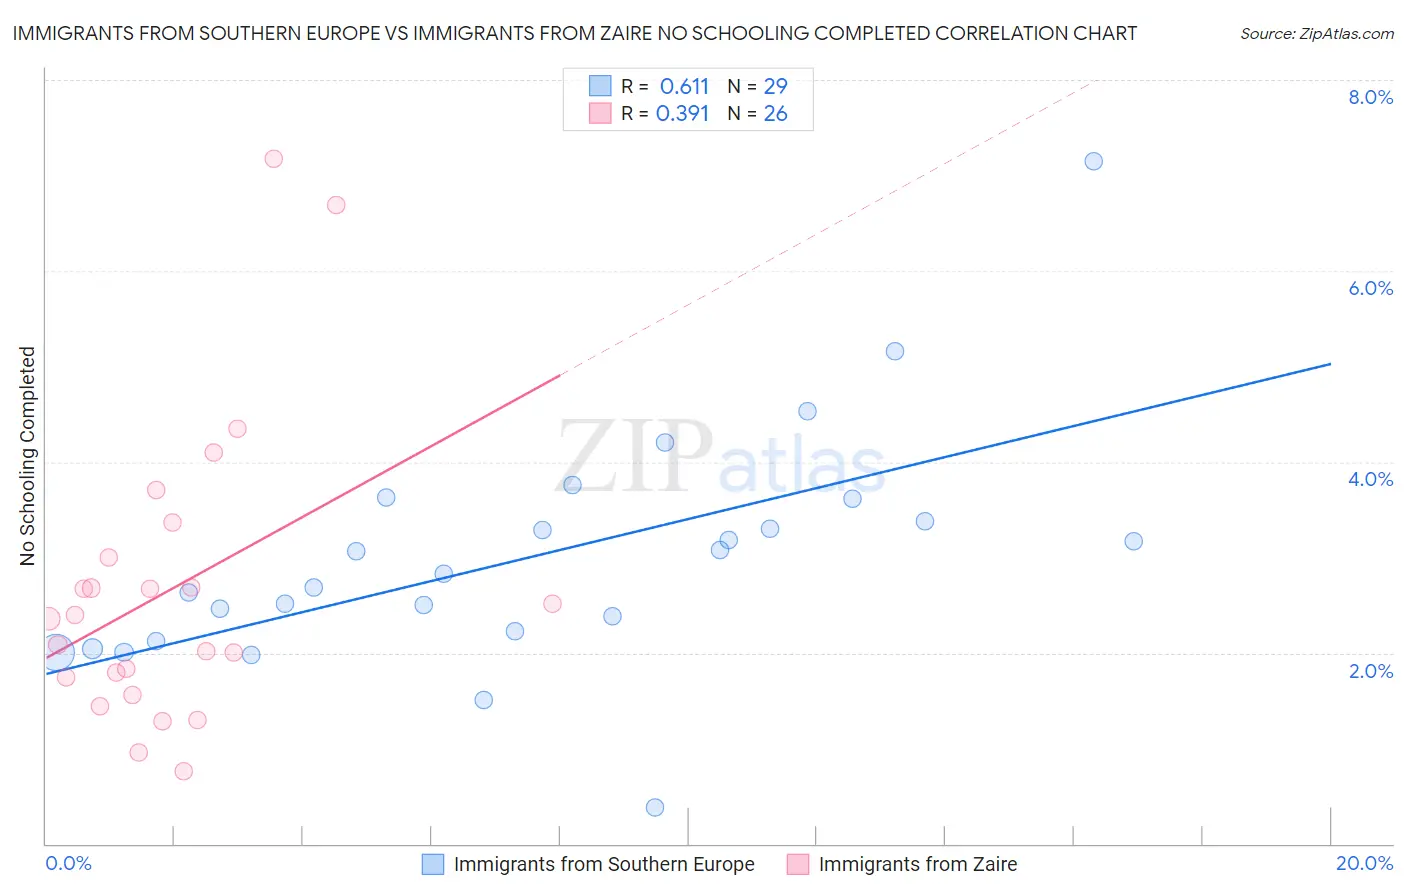
Immigrants from Southern Europe vs Immigrants from Zaire No Schooling Completed Correlation Chart
The statistical analysis conducted on geographies consisting of 398,295,822 people shows a significant positive correlation between the proportion of Immigrants from Southern Europe and percentage of population with no schooling in the United States with a correlation coefficient (R) of 0.611 and weighted average of 2.2%. Similarly, the statistical analysis conducted on geographies consisting of 107,090,561 people shows a mild positive correlation between the proportion of Immigrants from Zaire and percentage of population with no schooling in the United States with a correlation coefficient (R) of 0.391 and weighted average of 2.3%, a difference of 4.5%.
No Schooling Completed Correlation Summary
| Measurement | Immigrants from Southern Europe | Immigrants from Zaire |
| Minimum | 0.38% | 0.76% |
| Maximum | 7.1% | 7.2% |
| Range | 6.8% | 6.4% |
| Mean | 3.0% | 2.7% |
| Median | 2.8% | 2.4% |
| Interquartile 25% (IQ1) | 2.2% | 1.7% |
| Interquartile 75% (IQ3) | 3.5% | 3.0% |
| Interquartile Range (IQR) | 1.3% | 1.3% |
| Standard Deviation (Sample) | 1.2% | 1.5% |
| Standard Deviation (Population) | 1.2% | 1.5% |
Demographics Similar to Immigrants from Southern Europe and Immigrants from Zaire by No Schooling Completed
In terms of no schooling completed, the demographic groups most similar to Immigrants from Southern Europe are Immigrants from Chile (2.2%, a difference of 0.18%), African (2.2%, a difference of 0.35%), Immigrants from Ukraine (2.2%, a difference of 0.41%), Immigrants from Northern Africa (2.2%, a difference of 0.82%), and Costa Rican (2.2%, a difference of 1.3%). Similarly, the demographic groups most similar to Immigrants from Zaire are Tongan (2.3%, a difference of 0.20%), Samoan (2.3%, a difference of 0.43%), Ute (2.3%, a difference of 0.47%), Immigrants from Morocco (2.3%, a difference of 0.66%), and Immigrants from Panama (2.3%, a difference of 0.67%).
| Demographics | Rating | Rank | No Schooling Completed |
| Immigrants | Ukraine | 26.1 /100 | #196 | Fair 2.2% |
| Immigrants | Southern Europe | 23.8 /100 | #197 | Fair 2.2% |
| Immigrants | Chile | 22.7 /100 | #198 | Fair 2.2% |
| Africans | 21.8 /100 | #199 | Fair 2.2% |
| Immigrants | Northern Africa | 19.5 /100 | #200 | Poor 2.2% |
| Costa Ricans | 17.1 /100 | #201 | Poor 2.2% |
| Moroccans | 13.7 /100 | #202 | Poor 2.2% |
| Laotians | 13.3 /100 | #203 | Poor 2.2% |
| Hopi | 12.9 /100 | #204 | Poor 2.2% |
| Immigrants | Bahamas | 11.6 /100 | #205 | Poor 2.2% |
| Bahamians | 11.6 /100 | #206 | Poor 2.2% |
| South American Indians | 11.0 /100 | #207 | Poor 2.2% |
| Uruguayans | 11.0 /100 | #208 | Poor 2.2% |
| Immigrants | Oceania | 10.2 /100 | #209 | Poor 2.2% |
| Natives/Alaskans | 10.0 /100 | #210 | Tragic 2.2% |
| Immigrants | Panama | 8.8 /100 | #211 | Tragic 2.3% |
| Immigrants | Morocco | 8.7 /100 | #212 | Tragic 2.3% |
| Ute | 8.2 /100 | #213 | Tragic 2.3% |
| Samoans | 8.2 /100 | #214 | Tragic 2.3% |
| Immigrants | Zaire | 7.2 /100 | #215 | Tragic 2.3% |
| Tongans | 6.8 /100 | #216 | Tragic 2.3% |