Czechoslovakian vs Immigrants from Trinidad and Tobago 10th Grade
COMPARE
Czechoslovakian
Immigrants from Trinidad and Tobago
10th Grade
10th Grade Comparison
Czechoslovakians
Immigrants from Trinidad and Tobago
95.1%
10TH GRADE
99.9/ 100
METRIC RATING
46th/ 347
METRIC RANK
92.3%
10TH GRADE
0.1/ 100
METRIC RATING
276th/ 347
METRIC RANK
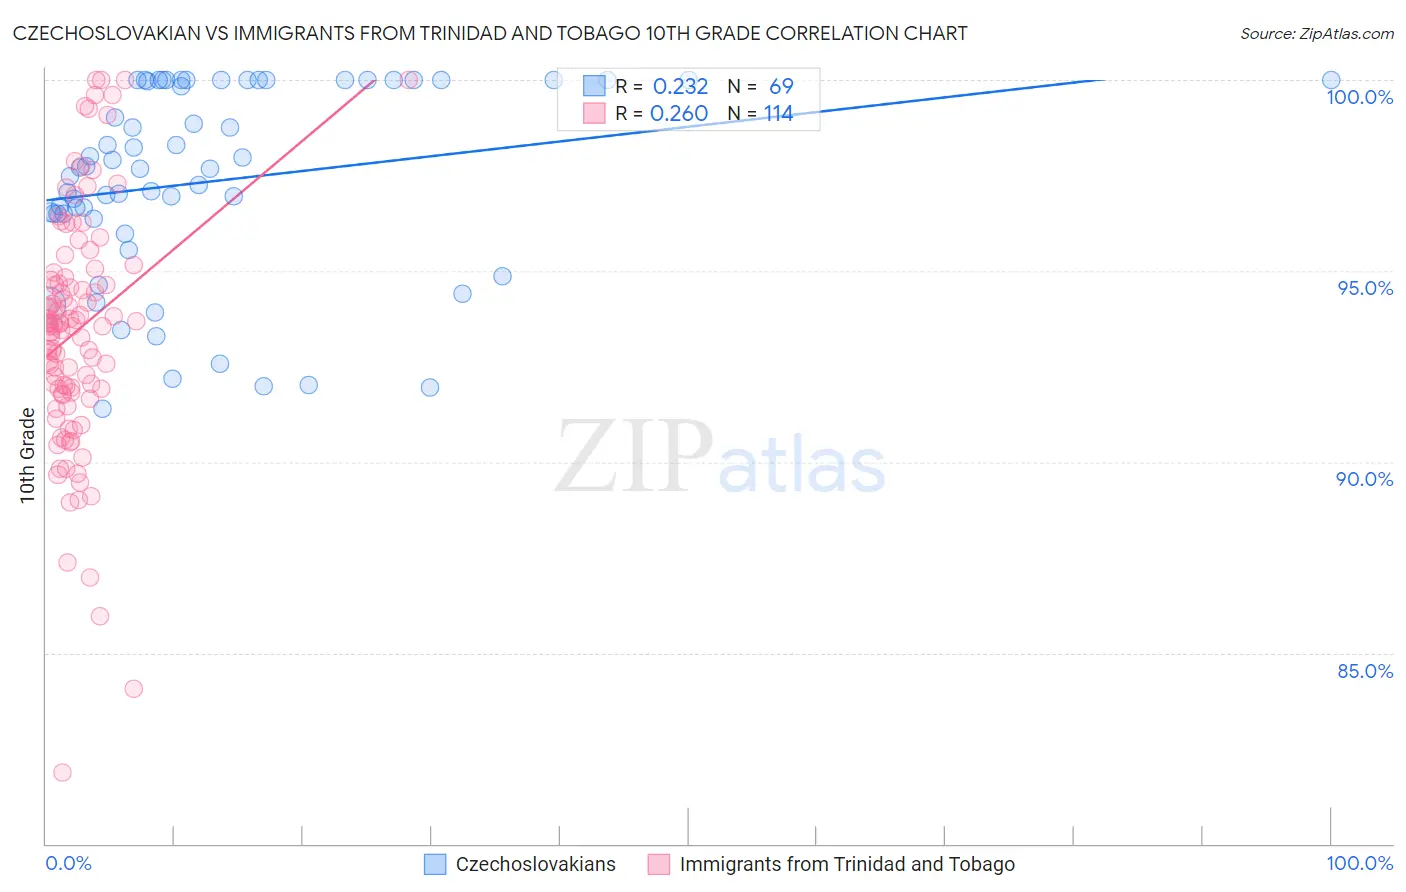
Czechoslovakian vs Immigrants from Trinidad and Tobago 10th Grade Correlation Chart
The statistical analysis conducted on geographies consisting of 368,668,876 people shows a weak positive correlation between the proportion of Czechoslovakians and percentage of population with at least 10th grade education in the United States with a correlation coefficient (R) of 0.232 and weighted average of 95.1%. Similarly, the statistical analysis conducted on geographies consisting of 223,526,834 people shows a weak positive correlation between the proportion of Immigrants from Trinidad and Tobago and percentage of population with at least 10th grade education in the United States with a correlation coefficient (R) of 0.260 and weighted average of 92.3%, a difference of 3.1%.
10th Grade Correlation Summary
| Measurement | Czechoslovakian | Immigrants from Trinidad and Tobago |
| Minimum | 91.4% | 81.9% |
| Maximum | 100.0% | 100.0% |
| Range | 8.6% | 18.1% |
| Mean | 97.4% | 93.4% |
| Median | 97.7% | 93.6% |
| Interquartile 25% (IQ1) | 96.4% | 91.8% |
| Interquartile 75% (IQ3) | 100.0% | 94.8% |
| Interquartile Range (IQR) | 3.6% | 3.0% |
| Standard Deviation (Sample) | 2.5% | 3.2% |
| Standard Deviation (Population) | 2.5% | 3.2% |
Similar Demographics by 10th Grade
Demographics Similar to Czechoslovakians by 10th Grade
In terms of 10th grade, the demographic groups most similar to Czechoslovakians are Immigrants from Northern Europe (95.2%, a difference of 0.010%), Greek (95.2%, a difference of 0.010%), Serbian (95.1%, a difference of 0.010%), Macedonian (95.2%, a difference of 0.020%), and Australian (95.1%, a difference of 0.020%).
| Demographics | Rating | Rank | 10th Grade |
| Immigrants | Scotland | 99.9 /100 | #39 | Exceptional 95.2% |
| Scotch-Irish | 99.9 /100 | #40 | Exceptional 95.2% |
| Russians | 99.9 /100 | #41 | Exceptional 95.2% |
| Slavs | 99.9 /100 | #42 | Exceptional 95.2% |
| Macedonians | 99.9 /100 | #43 | Exceptional 95.2% |
| Immigrants | Northern Europe | 99.9 /100 | #44 | Exceptional 95.2% |
| Greeks | 99.9 /100 | #45 | Exceptional 95.2% |
| Czechoslovakians | 99.9 /100 | #46 | Exceptional 95.1% |
| Serbians | 99.9 /100 | #47 | Exceptional 95.1% |
| Australians | 99.9 /100 | #48 | Exceptional 95.1% |
| Immigrants | Austria | 99.9 /100 | #49 | Exceptional 95.1% |
| Immigrants | Canada | 99.8 /100 | #50 | Exceptional 95.1% |
| Austrians | 99.8 /100 | #51 | Exceptional 95.1% |
| Ottawa | 99.8 /100 | #52 | Exceptional 95.1% |
| Immigrants | North America | 99.8 /100 | #53 | Exceptional 95.0% |
Demographics Similar to Immigrants from Trinidad and Tobago by 10th Grade
In terms of 10th grade, the demographic groups most similar to Immigrants from Trinidad and Tobago are Navajo (92.3%, a difference of 0.070%), Barbadian (92.2%, a difference of 0.11%), West Indian (92.4%, a difference of 0.12%), Native/Alaskan (92.2%, a difference of 0.12%), and Trinidadian and Tobagonian (92.4%, a difference of 0.13%).
| Demographics | Rating | Rank | 10th Grade |
| Immigrants | Colombia | 0.3 /100 | #269 | Tragic 92.5% |
| Immigrants | Uruguay | 0.3 /100 | #270 | Tragic 92.5% |
| Immigrants | Eritrea | 0.3 /100 | #271 | Tragic 92.5% |
| Immigrants | Western Africa | 0.3 /100 | #272 | Tragic 92.5% |
| Trinidadians and Tobagonians | 0.2 /100 | #273 | Tragic 92.4% |
| Immigrants | Congo | 0.2 /100 | #274 | Tragic 92.4% |
| West Indians | 0.2 /100 | #275 | Tragic 92.4% |
| Immigrants | Trinidad and Tobago | 0.1 /100 | #276 | Tragic 92.3% |
| Navajo | 0.1 /100 | #277 | Tragic 92.3% |
| Barbadians | 0.1 /100 | #278 | Tragic 92.2% |
| Natives/Alaskans | 0.1 /100 | #279 | Tragic 92.2% |
| Malaysians | 0.1 /100 | #280 | Tragic 92.2% |
| Bangladeshis | 0.1 /100 | #281 | Tragic 92.2% |
| Immigrants | Peru | 0.1 /100 | #282 | Tragic 92.2% |
| Immigrants | St. Vincent and the Grenadines | 0.0 /100 | #283 | Tragic 92.1% |