Czechoslovakian vs Immigrants from Nepal 10th Grade
COMPARE
Czechoslovakian
Immigrants from Nepal
10th Grade
10th Grade Comparison
Czechoslovakians
Immigrants from Nepal
95.1%
10TH GRADE
99.9/ 100
METRIC RATING
46th/ 347
METRIC RANK
93.7%
10TH GRADE
49.6/ 100
METRIC RATING
175th/ 347
METRIC RANK
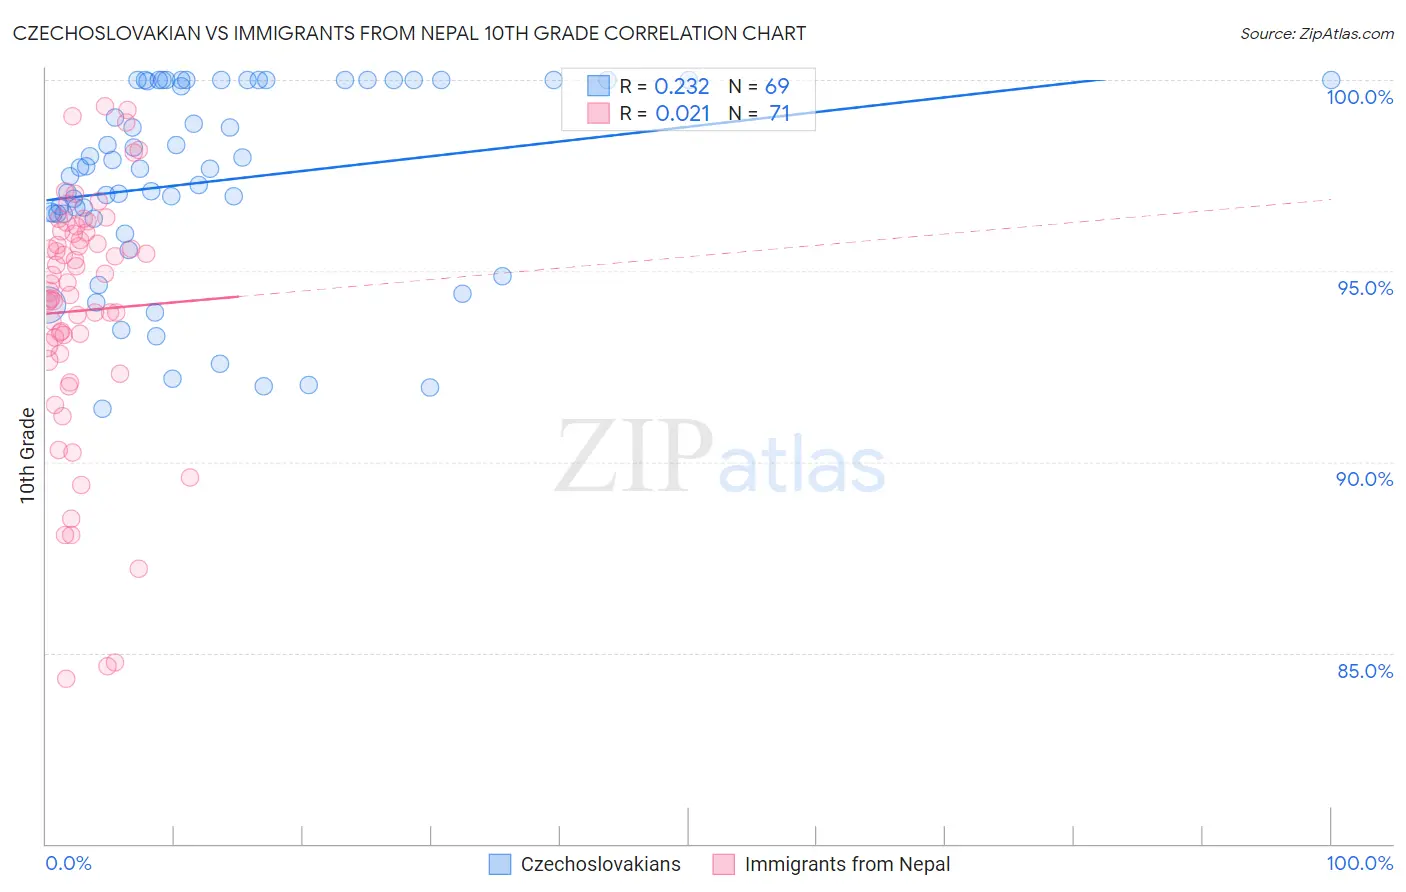
Czechoslovakian vs Immigrants from Nepal 10th Grade Correlation Chart
The statistical analysis conducted on geographies consisting of 368,668,876 people shows a weak positive correlation between the proportion of Czechoslovakians and percentage of population with at least 10th grade education in the United States with a correlation coefficient (R) of 0.232 and weighted average of 95.1%. Similarly, the statistical analysis conducted on geographies consisting of 186,636,986 people shows no correlation between the proportion of Immigrants from Nepal and percentage of population with at least 10th grade education in the United States with a correlation coefficient (R) of 0.021 and weighted average of 93.7%, a difference of 1.5%.
10th Grade Correlation Summary
| Measurement | Czechoslovakian | Immigrants from Nepal |
| Minimum | 91.4% | 84.3% |
| Maximum | 100.0% | 99.3% |
| Range | 8.6% | 15.0% |
| Mean | 97.4% | 94.0% |
| Median | 97.7% | 94.7% |
| Interquartile 25% (IQ1) | 96.4% | 92.8% |
| Interquartile 75% (IQ3) | 100.0% | 96.0% |
| Interquartile Range (IQR) | 3.6% | 3.2% |
| Standard Deviation (Sample) | 2.5% | 3.3% |
| Standard Deviation (Population) | 2.5% | 3.3% |
Similar Demographics by 10th Grade
Demographics Similar to Czechoslovakians by 10th Grade
In terms of 10th grade, the demographic groups most similar to Czechoslovakians are Immigrants from Northern Europe (95.2%, a difference of 0.010%), Greek (95.2%, a difference of 0.010%), Serbian (95.1%, a difference of 0.010%), Macedonian (95.2%, a difference of 0.020%), and Australian (95.1%, a difference of 0.020%).
| Demographics | Rating | Rank | 10th Grade |
| Immigrants | Scotland | 99.9 /100 | #39 | Exceptional 95.2% |
| Scotch-Irish | 99.9 /100 | #40 | Exceptional 95.2% |
| Russians | 99.9 /100 | #41 | Exceptional 95.2% |
| Slavs | 99.9 /100 | #42 | Exceptional 95.2% |
| Macedonians | 99.9 /100 | #43 | Exceptional 95.2% |
| Immigrants | Northern Europe | 99.9 /100 | #44 | Exceptional 95.2% |
| Greeks | 99.9 /100 | #45 | Exceptional 95.2% |
| Czechoslovakians | 99.9 /100 | #46 | Exceptional 95.1% |
| Serbians | 99.9 /100 | #47 | Exceptional 95.1% |
| Australians | 99.9 /100 | #48 | Exceptional 95.1% |
| Immigrants | Austria | 99.9 /100 | #49 | Exceptional 95.1% |
| Immigrants | Canada | 99.8 /100 | #50 | Exceptional 95.1% |
| Austrians | 99.8 /100 | #51 | Exceptional 95.1% |
| Ottawa | 99.8 /100 | #52 | Exceptional 95.1% |
| Immigrants | North America | 99.8 /100 | #53 | Exceptional 95.0% |
Demographics Similar to Immigrants from Nepal by 10th Grade
In terms of 10th grade, the demographic groups most similar to Immigrants from Nepal are Argentinean (93.7%, a difference of 0.0%), French American Indian (93.7%, a difference of 0.010%), Spaniard (93.7%, a difference of 0.010%), Immigrants from Albania (93.8%, a difference of 0.020%), and Immigrants from Argentina (93.7%, a difference of 0.020%).
| Demographics | Rating | Rank | 10th Grade |
| Alsatians | 59.4 /100 | #168 | Average 93.8% |
| Immigrants | Spain | 55.9 /100 | #169 | Average 93.8% |
| Immigrants | Venezuela | 53.9 /100 | #170 | Average 93.8% |
| Immigrants | Albania | 52.4 /100 | #171 | Average 93.8% |
| French American Indians | 50.9 /100 | #172 | Average 93.7% |
| Spaniards | 50.3 /100 | #173 | Average 93.7% |
| Argentineans | 50.0 /100 | #174 | Average 93.7% |
| Immigrants | Nepal | 49.6 /100 | #175 | Average 93.7% |
| Immigrants | Argentina | 47.1 /100 | #176 | Average 93.7% |
| Immigrants | Lebanon | 47.1 /100 | #177 | Average 93.7% |
| Sierra Leoneans | 46.1 /100 | #178 | Average 93.7% |
| Paraguayans | 45.3 /100 | #179 | Average 93.7% |
| Blackfeet | 42.8 /100 | #180 | Average 93.7% |
| Immigrants | Northern Africa | 41.6 /100 | #181 | Average 93.7% |
| Colville | 38.8 /100 | #182 | Fair 93.6% |