Czechoslovakian vs British West Indian 10th Grade
COMPARE
Czechoslovakian
British West Indian
10th Grade
10th Grade Comparison
Czechoslovakians
British West Indians
95.1%
10TH GRADE
99.9/ 100
METRIC RATING
46th/ 347
METRIC RANK
91.8%
10TH GRADE
0.0/ 100
METRIC RATING
290th/ 347
METRIC RANK
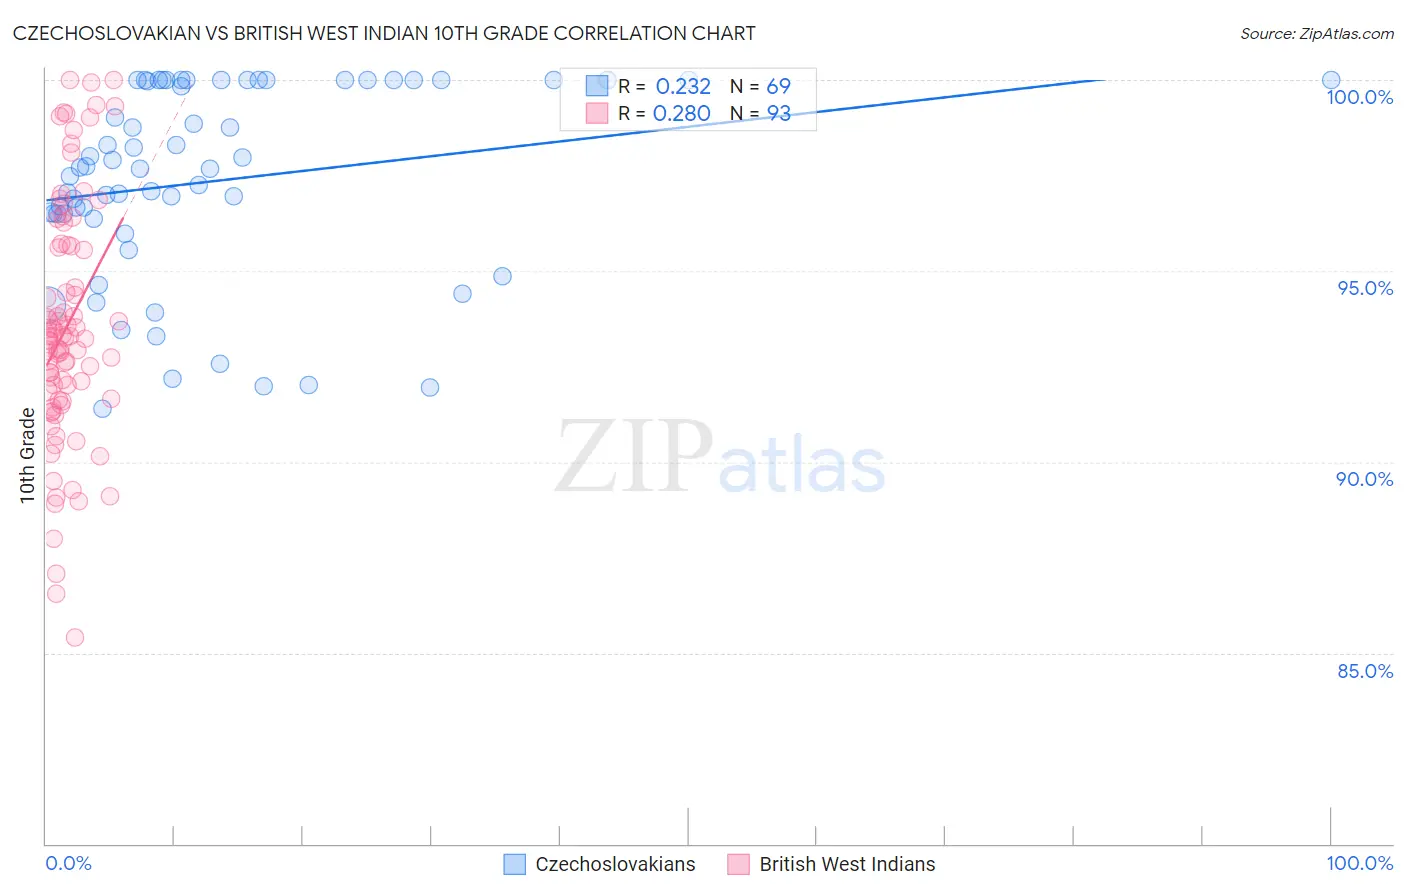
Czechoslovakian vs British West Indian 10th Grade Correlation Chart
The statistical analysis conducted on geographies consisting of 368,668,876 people shows a weak positive correlation between the proportion of Czechoslovakians and percentage of population with at least 10th grade education in the United States with a correlation coefficient (R) of 0.232 and weighted average of 95.1%. Similarly, the statistical analysis conducted on geographies consisting of 152,698,597 people shows a weak positive correlation between the proportion of British West Indians and percentage of population with at least 10th grade education in the United States with a correlation coefficient (R) of 0.280 and weighted average of 91.8%, a difference of 3.6%.
10th Grade Correlation Summary
| Measurement | Czechoslovakian | British West Indian |
| Minimum | 91.4% | 85.4% |
| Maximum | 100.0% | 100.0% |
| Range | 8.6% | 14.6% |
| Mean | 97.4% | 93.5% |
| Median | 97.7% | 93.2% |
| Interquartile 25% (IQ1) | 96.4% | 91.6% |
| Interquartile 75% (IQ3) | 100.0% | 95.7% |
| Interquartile Range (IQR) | 3.6% | 4.0% |
| Standard Deviation (Sample) | 2.5% | 3.2% |
| Standard Deviation (Population) | 2.5% | 3.1% |
Similar Demographics by 10th Grade
Demographics Similar to Czechoslovakians by 10th Grade
In terms of 10th grade, the demographic groups most similar to Czechoslovakians are Immigrants from Northern Europe (95.2%, a difference of 0.010%), Greek (95.2%, a difference of 0.010%), Serbian (95.1%, a difference of 0.010%), Macedonian (95.2%, a difference of 0.020%), and Australian (95.1%, a difference of 0.020%).
| Demographics | Rating | Rank | 10th Grade |
| Immigrants | Scotland | 99.9 /100 | #39 | Exceptional 95.2% |
| Scotch-Irish | 99.9 /100 | #40 | Exceptional 95.2% |
| Russians | 99.9 /100 | #41 | Exceptional 95.2% |
| Slavs | 99.9 /100 | #42 | Exceptional 95.2% |
| Macedonians | 99.9 /100 | #43 | Exceptional 95.2% |
| Immigrants | Northern Europe | 99.9 /100 | #44 | Exceptional 95.2% |
| Greeks | 99.9 /100 | #45 | Exceptional 95.2% |
| Czechoslovakians | 99.9 /100 | #46 | Exceptional 95.1% |
| Serbians | 99.9 /100 | #47 | Exceptional 95.1% |
| Australians | 99.9 /100 | #48 | Exceptional 95.1% |
| Immigrants | Austria | 99.9 /100 | #49 | Exceptional 95.1% |
| Immigrants | Canada | 99.8 /100 | #50 | Exceptional 95.1% |
| Austrians | 99.8 /100 | #51 | Exceptional 95.1% |
| Ottawa | 99.8 /100 | #52 | Exceptional 95.1% |
| Immigrants | North America | 99.8 /100 | #53 | Exceptional 95.0% |
Demographics Similar to British West Indians by 10th Grade
In terms of 10th grade, the demographic groups most similar to British West Indians are Immigrants from West Indies (91.8%, a difference of 0.0%), Immigrants from Burma/Myanmar (91.8%, a difference of 0.010%), Sri Lankan (91.8%, a difference of 0.020%), Indonesian (91.8%, a difference of 0.030%), and Pennsylvania German (91.9%, a difference of 0.060%).
| Demographics | Rating | Rank | 10th Grade |
| Immigrants | St. Vincent and the Grenadines | 0.0 /100 | #283 | Tragic 92.1% |
| Immigrants | Barbados | 0.0 /100 | #284 | Tragic 92.1% |
| Immigrants | South Eastern Asia | 0.0 /100 | #285 | Tragic 92.1% |
| Yuman | 0.0 /100 | #286 | Tragic 92.0% |
| Pennsylvania Germans | 0.0 /100 | #287 | Tragic 91.9% |
| Immigrants | Laos | 0.0 /100 | #288 | Tragic 91.9% |
| Sri Lankans | 0.0 /100 | #289 | Tragic 91.8% |
| British West Indians | 0.0 /100 | #290 | Tragic 91.8% |
| Immigrants | West Indies | 0.0 /100 | #291 | Tragic 91.8% |
| Immigrants | Burma/Myanmar | 0.0 /100 | #292 | Tragic 91.8% |
| Indonesians | 0.0 /100 | #293 | Tragic 91.8% |
| Haitians | 0.0 /100 | #294 | Tragic 91.8% |
| Lumbee | 0.0 /100 | #295 | Tragic 91.7% |
| Immigrants | Grenada | 0.0 /100 | #296 | Tragic 91.6% |
| Fijians | 0.0 /100 | #297 | Tragic 91.5% |