Nepalese vs Immigrants from Trinidad and Tobago 10th Grade
COMPARE
Nepalese
Immigrants from Trinidad and Tobago
10th Grade
10th Grade Comparison
Nepalese
Immigrants from Trinidad and Tobago
90.7%
10TH GRADE
0.0/ 100
METRIC RATING
314th/ 347
METRIC RANK
92.3%
10TH GRADE
0.1/ 100
METRIC RATING
276th/ 347
METRIC RANK
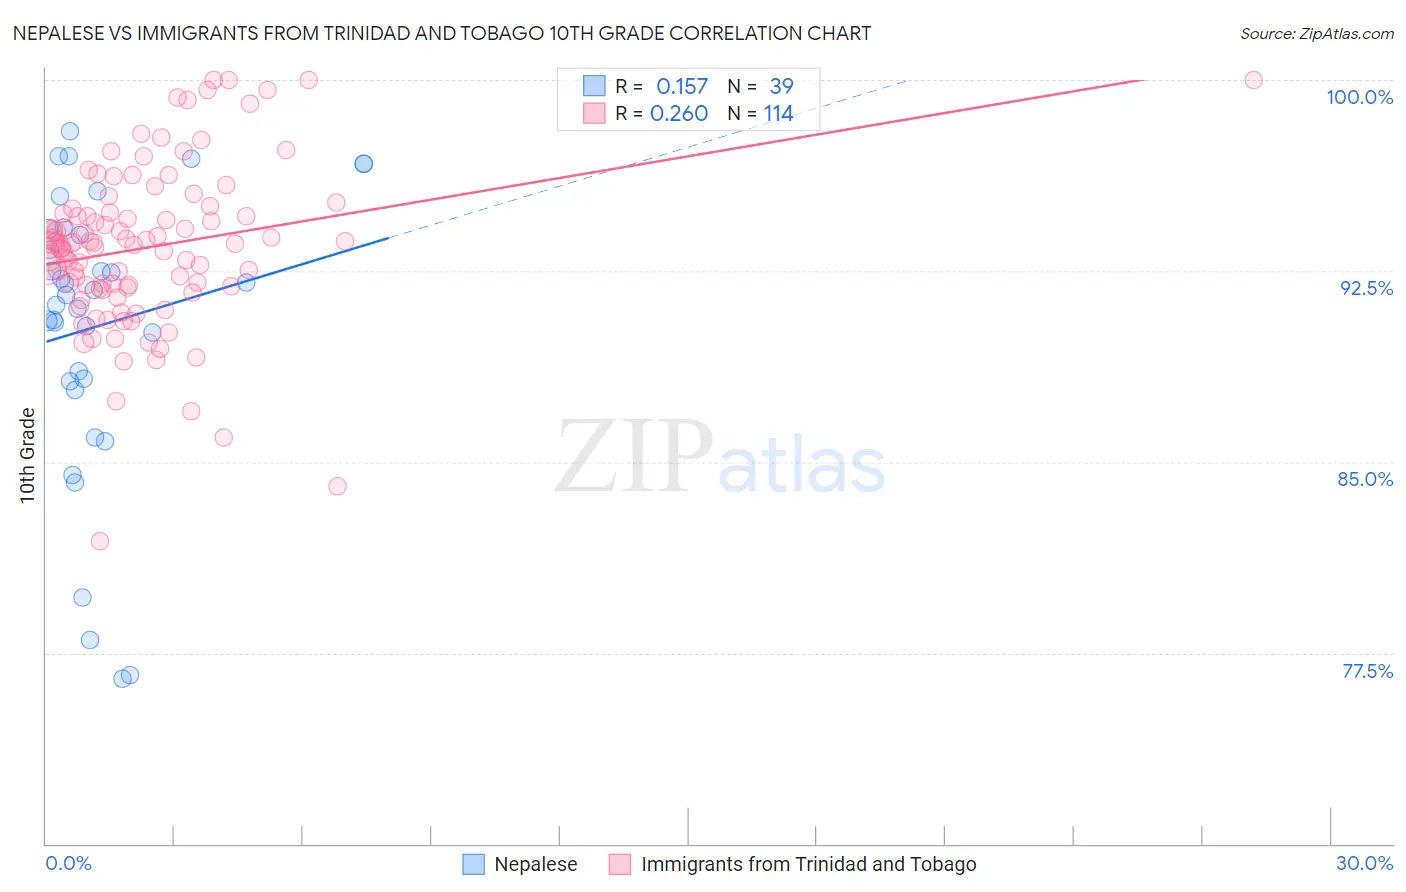
Nepalese vs Immigrants from Trinidad and Tobago 10th Grade Correlation Chart
The statistical analysis conducted on geographies consisting of 24,519,269 people shows a poor positive correlation between the proportion of Nepalese and percentage of population with at least 10th grade education in the United States with a correlation coefficient (R) of 0.157 and weighted average of 90.7%. Similarly, the statistical analysis conducted on geographies consisting of 223,526,834 people shows a weak positive correlation between the proportion of Immigrants from Trinidad and Tobago and percentage of population with at least 10th grade education in the United States with a correlation coefficient (R) of 0.260 and weighted average of 92.3%, a difference of 1.8%.
10th Grade Correlation Summary
| Measurement | Nepalese | Immigrants from Trinidad and Tobago |
| Minimum | 76.5% | 81.9% |
| Maximum | 98.0% | 100.0% |
| Range | 21.5% | 18.1% |
| Mean | 90.4% | 93.4% |
| Median | 91.5% | 93.6% |
| Interquartile 25% (IQ1) | 88.2% | 91.8% |
| Interquartile 75% (IQ3) | 94.1% | 94.8% |
| Interquartile Range (IQR) | 6.0% | 3.0% |
| Standard Deviation (Sample) | 5.6% | 3.2% |
| Standard Deviation (Population) | 5.5% | 3.2% |
Similar Demographics by 10th Grade
Demographics Similar to Nepalese by 10th Grade
In terms of 10th grade, the demographic groups most similar to Nepalese are Cape Verdean (90.8%, a difference of 0.080%), Immigrants from Caribbean (90.6%, a difference of 0.080%), Ecuadorian (90.6%, a difference of 0.090%), Immigrants from Portugal (90.8%, a difference of 0.11%), and Immigrants from Ecuador (90.4%, a difference of 0.26%).
| Demographics | Rating | Rank | 10th Grade |
| Immigrants | Fiji | 0.0 /100 | #307 | Tragic 91.0% |
| Immigrants | Bangladesh | 0.0 /100 | #308 | Tragic 91.0% |
| Immigrants | Immigrants | 0.0 /100 | #309 | Tragic 91.0% |
| Vietnamese | 0.0 /100 | #310 | Tragic 90.9% |
| Immigrants | Cambodia | 0.0 /100 | #311 | Tragic 90.9% |
| Immigrants | Portugal | 0.0 /100 | #312 | Tragic 90.8% |
| Cape Verdeans | 0.0 /100 | #313 | Tragic 90.8% |
| Nepalese | 0.0 /100 | #314 | Tragic 90.7% |
| Immigrants | Caribbean | 0.0 /100 | #315 | Tragic 90.6% |
| Ecuadorians | 0.0 /100 | #316 | Tragic 90.6% |
| Immigrants | Ecuador | 0.0 /100 | #317 | Tragic 90.4% |
| Immigrants | Cuba | 0.0 /100 | #318 | Tragic 90.2% |
| Nicaraguans | 0.0 /100 | #319 | Tragic 90.2% |
| Houma | 0.0 /100 | #320 | Tragic 90.2% |
| Belizeans | 0.0 /100 | #321 | Tragic 90.2% |
Demographics Similar to Immigrants from Trinidad and Tobago by 10th Grade
In terms of 10th grade, the demographic groups most similar to Immigrants from Trinidad and Tobago are Navajo (92.3%, a difference of 0.070%), Barbadian (92.2%, a difference of 0.11%), West Indian (92.4%, a difference of 0.12%), Native/Alaskan (92.2%, a difference of 0.12%), and Trinidadian and Tobagonian (92.4%, a difference of 0.13%).
| Demographics | Rating | Rank | 10th Grade |
| Immigrants | Colombia | 0.3 /100 | #269 | Tragic 92.5% |
| Immigrants | Uruguay | 0.3 /100 | #270 | Tragic 92.5% |
| Immigrants | Eritrea | 0.3 /100 | #271 | Tragic 92.5% |
| Immigrants | Western Africa | 0.3 /100 | #272 | Tragic 92.5% |
| Trinidadians and Tobagonians | 0.2 /100 | #273 | Tragic 92.4% |
| Immigrants | Congo | 0.2 /100 | #274 | Tragic 92.4% |
| West Indians | 0.2 /100 | #275 | Tragic 92.4% |
| Immigrants | Trinidad and Tobago | 0.1 /100 | #276 | Tragic 92.3% |
| Navajo | 0.1 /100 | #277 | Tragic 92.3% |
| Barbadians | 0.1 /100 | #278 | Tragic 92.2% |
| Natives/Alaskans | 0.1 /100 | #279 | Tragic 92.2% |
| Malaysians | 0.1 /100 | #280 | Tragic 92.2% |
| Bangladeshis | 0.1 /100 | #281 | Tragic 92.2% |
| Immigrants | Peru | 0.1 /100 | #282 | Tragic 92.2% |
| Immigrants | St. Vincent and the Grenadines | 0.0 /100 | #283 | Tragic 92.1% |