Uruguayan vs Immigrants from Trinidad and Tobago 10th Grade
COMPARE
Uruguayan
Immigrants from Trinidad and Tobago
10th Grade
10th Grade Comparison
Uruguayans
Immigrants from Trinidad and Tobago
92.9%
10TH GRADE
1.8/ 100
METRIC RATING
245th/ 347
METRIC RANK
92.3%
10TH GRADE
0.1/ 100
METRIC RATING
276th/ 347
METRIC RANK
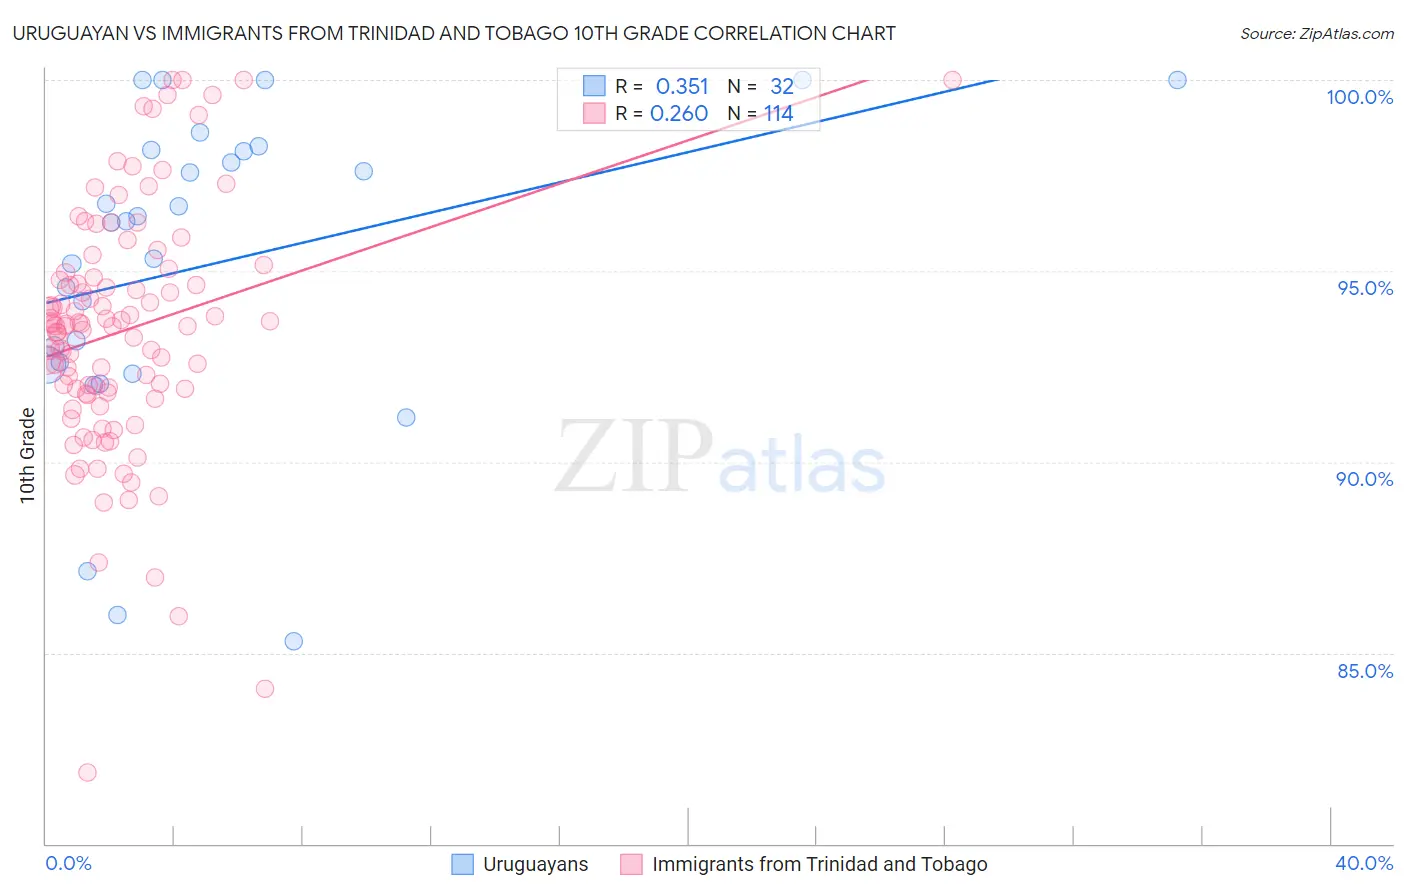
Uruguayan vs Immigrants from Trinidad and Tobago 10th Grade Correlation Chart
The statistical analysis conducted on geographies consisting of 144,782,794 people shows a mild positive correlation between the proportion of Uruguayans and percentage of population with at least 10th grade education in the United States with a correlation coefficient (R) of 0.351 and weighted average of 92.9%. Similarly, the statistical analysis conducted on geographies consisting of 223,526,834 people shows a weak positive correlation between the proportion of Immigrants from Trinidad and Tobago and percentage of population with at least 10th grade education in the United States with a correlation coefficient (R) of 0.260 and weighted average of 92.3%, a difference of 0.63%.
10th Grade Correlation Summary
| Measurement | Uruguayan | Immigrants from Trinidad and Tobago |
| Minimum | 85.3% | 81.9% |
| Maximum | 100.0% | 100.0% |
| Range | 14.7% | 18.1% |
| Mean | 95.2% | 93.4% |
| Median | 96.3% | 93.6% |
| Interquartile 25% (IQ1) | 92.6% | 91.8% |
| Interquartile 75% (IQ3) | 98.1% | 94.8% |
| Interquartile Range (IQR) | 5.6% | 3.0% |
| Standard Deviation (Sample) | 4.0% | 3.2% |
| Standard Deviation (Population) | 3.9% | 3.2% |
Similar Demographics by 10th Grade
Demographics Similar to Uruguayans by 10th Grade
In terms of 10th grade, the demographic groups most similar to Uruguayans are Immigrants from Middle Africa (92.9%, a difference of 0.020%), Spanish American (92.9%, a difference of 0.030%), Senegalese (93.0%, a difference of 0.060%), Immigrants from Afghanistan (92.8%, a difference of 0.060%), and Colombian (92.8%, a difference of 0.070%).
| Demographics | Rating | Rank | 10th Grade |
| Nigerians | 4.2 /100 | #238 | Tragic 93.1% |
| Costa Ricans | 4.2 /100 | #239 | Tragic 93.1% |
| Immigrants | Hong Kong | 4.2 /100 | #240 | Tragic 93.1% |
| Immigrants | Somalia | 2.7 /100 | #241 | Tragic 93.0% |
| Immigrants | Cameroon | 2.6 /100 | #242 | Tragic 93.0% |
| Senegalese | 2.4 /100 | #243 | Tragic 93.0% |
| Spanish Americans | 2.1 /100 | #244 | Tragic 92.9% |
| Uruguayans | 1.8 /100 | #245 | Tragic 92.9% |
| Immigrants | Middle Africa | 1.7 /100 | #246 | Tragic 92.9% |
| Immigrants | Afghanistan | 1.4 /100 | #247 | Tragic 92.8% |
| Colombians | 1.4 /100 | #248 | Tragic 92.8% |
| Immigrants | Senegal | 1.4 /100 | #249 | Tragic 92.8% |
| Jamaicans | 1.2 /100 | #250 | Tragic 92.8% |
| Immigrants | Thailand | 1.0 /100 | #251 | Tragic 92.8% |
| South Americans | 0.9 /100 | #252 | Tragic 92.8% |
Demographics Similar to Immigrants from Trinidad and Tobago by 10th Grade
In terms of 10th grade, the demographic groups most similar to Immigrants from Trinidad and Tobago are Navajo (92.3%, a difference of 0.070%), Barbadian (92.2%, a difference of 0.11%), West Indian (92.4%, a difference of 0.12%), Native/Alaskan (92.2%, a difference of 0.12%), and Trinidadian and Tobagonian (92.4%, a difference of 0.13%).
| Demographics | Rating | Rank | 10th Grade |
| Immigrants | Colombia | 0.3 /100 | #269 | Tragic 92.5% |
| Immigrants | Uruguay | 0.3 /100 | #270 | Tragic 92.5% |
| Immigrants | Eritrea | 0.3 /100 | #271 | Tragic 92.5% |
| Immigrants | Western Africa | 0.3 /100 | #272 | Tragic 92.5% |
| Trinidadians and Tobagonians | 0.2 /100 | #273 | Tragic 92.4% |
| Immigrants | Congo | 0.2 /100 | #274 | Tragic 92.4% |
| West Indians | 0.2 /100 | #275 | Tragic 92.4% |
| Immigrants | Trinidad and Tobago | 0.1 /100 | #276 | Tragic 92.3% |
| Navajo | 0.1 /100 | #277 | Tragic 92.3% |
| Barbadians | 0.1 /100 | #278 | Tragic 92.2% |
| Natives/Alaskans | 0.1 /100 | #279 | Tragic 92.2% |
| Malaysians | 0.1 /100 | #280 | Tragic 92.2% |
| Bangladeshis | 0.1 /100 | #281 | Tragic 92.2% |
| Immigrants | Peru | 0.1 /100 | #282 | Tragic 92.2% |
| Immigrants | St. Vincent and the Grenadines | 0.0 /100 | #283 | Tragic 92.1% |