Czechoslovakian vs Immigrants from Trinidad and Tobago 8th Grade
COMPARE
Czechoslovakian
Immigrants from Trinidad and Tobago
8th Grade
8th Grade Comparison
Czechoslovakians
Immigrants from Trinidad and Tobago
96.9%
8TH GRADE
99.9/ 100
METRIC RATING
46th/ 347
METRIC RANK
94.6%
8TH GRADE
0.1/ 100
METRIC RATING
279th/ 347
METRIC RANK
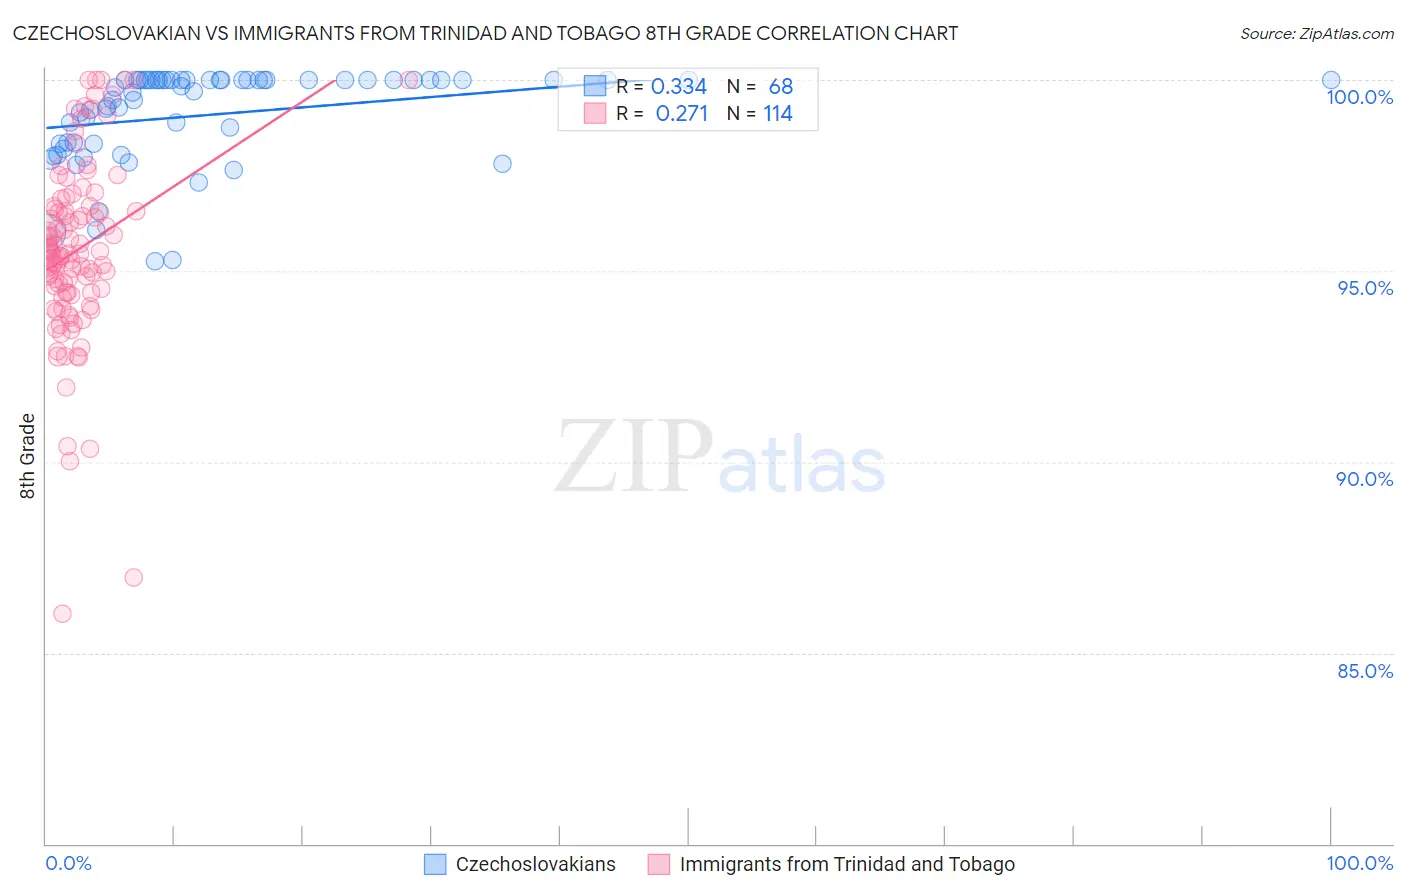
Czechoslovakian vs Immigrants from Trinidad and Tobago 8th Grade Correlation Chart
The statistical analysis conducted on geographies consisting of 368,657,544 people shows a mild positive correlation between the proportion of Czechoslovakians and percentage of population with at least 8th grade education in the United States with a correlation coefficient (R) of 0.334 and weighted average of 96.9%. Similarly, the statistical analysis conducted on geographies consisting of 223,526,834 people shows a weak positive correlation between the proportion of Immigrants from Trinidad and Tobago and percentage of population with at least 8th grade education in the United States with a correlation coefficient (R) of 0.271 and weighted average of 94.6%, a difference of 2.3%.
8th Grade Correlation Summary
| Measurement | Czechoslovakian | Immigrants from Trinidad and Tobago |
| Minimum | 95.3% | 86.0% |
| Maximum | 100.0% | 100.0% |
| Range | 4.7% | 14.0% |
| Mean | 99.1% | 95.5% |
| Median | 99.8% | 95.5% |
| Interquartile 25% (IQ1) | 98.3% | 94.4% |
| Interquartile 75% (IQ3) | 100.0% | 96.6% |
| Interquartile Range (IQR) | 1.7% | 2.2% |
| Standard Deviation (Sample) | 1.2% | 2.4% |
| Standard Deviation (Population) | 1.2% | 2.4% |
Similar Demographics by 8th Grade
Demographics Similar to Czechoslovakians by 8th Grade
In terms of 8th grade, the demographic groups most similar to Czechoslovakians are Maltese (96.9%, a difference of 0.010%), Northern European (96.9%, a difference of 0.010%), Bulgarian (96.9%, a difference of 0.010%), Aleut (96.9%, a difference of 0.030%), and Slavic (96.8%, a difference of 0.040%).
| Demographics | Rating | Rank | 8th Grade |
| Hungarians | 100.0 /100 | #39 | Exceptional 97.0% |
| Inupiat | 100.0 /100 | #40 | Exceptional 97.0% |
| Eastern Europeans | 100.0 /100 | #41 | Exceptional 97.0% |
| Chinese | 100.0 /100 | #42 | Exceptional 96.9% |
| Aleuts | 99.9 /100 | #43 | Exceptional 96.9% |
| Maltese | 99.9 /100 | #44 | Exceptional 96.9% |
| Northern Europeans | 99.9 /100 | #45 | Exceptional 96.9% |
| Czechoslovakians | 99.9 /100 | #46 | Exceptional 96.9% |
| Bulgarians | 99.9 /100 | #47 | Exceptional 96.9% |
| Slavs | 99.9 /100 | #48 | Exceptional 96.8% |
| Estonians | 99.9 /100 | #49 | Exceptional 96.8% |
| Immigrants | Scotland | 99.9 /100 | #50 | Exceptional 96.8% |
| Celtics | 99.9 /100 | #51 | Exceptional 96.8% |
| Greeks | 99.9 /100 | #52 | Exceptional 96.8% |
| Austrians | 99.9 /100 | #53 | Exceptional 96.7% |
Demographics Similar to Immigrants from Trinidad and Tobago by 8th Grade
In terms of 8th grade, the demographic groups most similar to Immigrants from Trinidad and Tobago are Barbadian (94.6%, a difference of 0.0%), Armenian (94.7%, a difference of 0.010%), Immigrants from Bolivia (94.6%, a difference of 0.010%), Taiwanese (94.7%, a difference of 0.040%), and Immigrants from Eritrea (94.6%, a difference of 0.050%).
| Demographics | Rating | Rank | 8th Grade |
| Immigrants | South America | 0.2 /100 | #272 | Tragic 94.8% |
| Immigrants | Western Africa | 0.2 /100 | #273 | Tragic 94.8% |
| Trinidadians and Tobagonians | 0.2 /100 | #274 | Tragic 94.7% |
| Immigrants | Colombia | 0.2 /100 | #275 | Tragic 94.7% |
| Peruvians | 0.1 /100 | #276 | Tragic 94.7% |
| Taiwanese | 0.1 /100 | #277 | Tragic 94.7% |
| Armenians | 0.1 /100 | #278 | Tragic 94.7% |
| Immigrants | Trinidad and Tobago | 0.1 /100 | #279 | Tragic 94.6% |
| Barbadians | 0.1 /100 | #280 | Tragic 94.6% |
| Immigrants | Bolivia | 0.1 /100 | #281 | Tragic 94.6% |
| Immigrants | Eritrea | 0.1 /100 | #282 | Tragic 94.6% |
| Immigrants | St. Vincent and the Grenadines | 0.1 /100 | #283 | Tragic 94.6% |
| Immigrants | Philippines | 0.1 /100 | #284 | Tragic 94.6% |
| Immigrants | Barbados | 0.0 /100 | #285 | Tragic 94.5% |
| Immigrants | Peru | 0.0 /100 | #286 | Tragic 94.5% |