Czechoslovakian vs Immigrants from Dominica 10th Grade
COMPARE
Czechoslovakian
Immigrants from Dominica
10th Grade
10th Grade Comparison
Czechoslovakians
Immigrants from Dominica
95.1%
10TH GRADE
99.9/ 100
METRIC RATING
46th/ 347
METRIC RANK
91.1%
10TH GRADE
0.0/ 100
METRIC RATING
305th/ 347
METRIC RANK
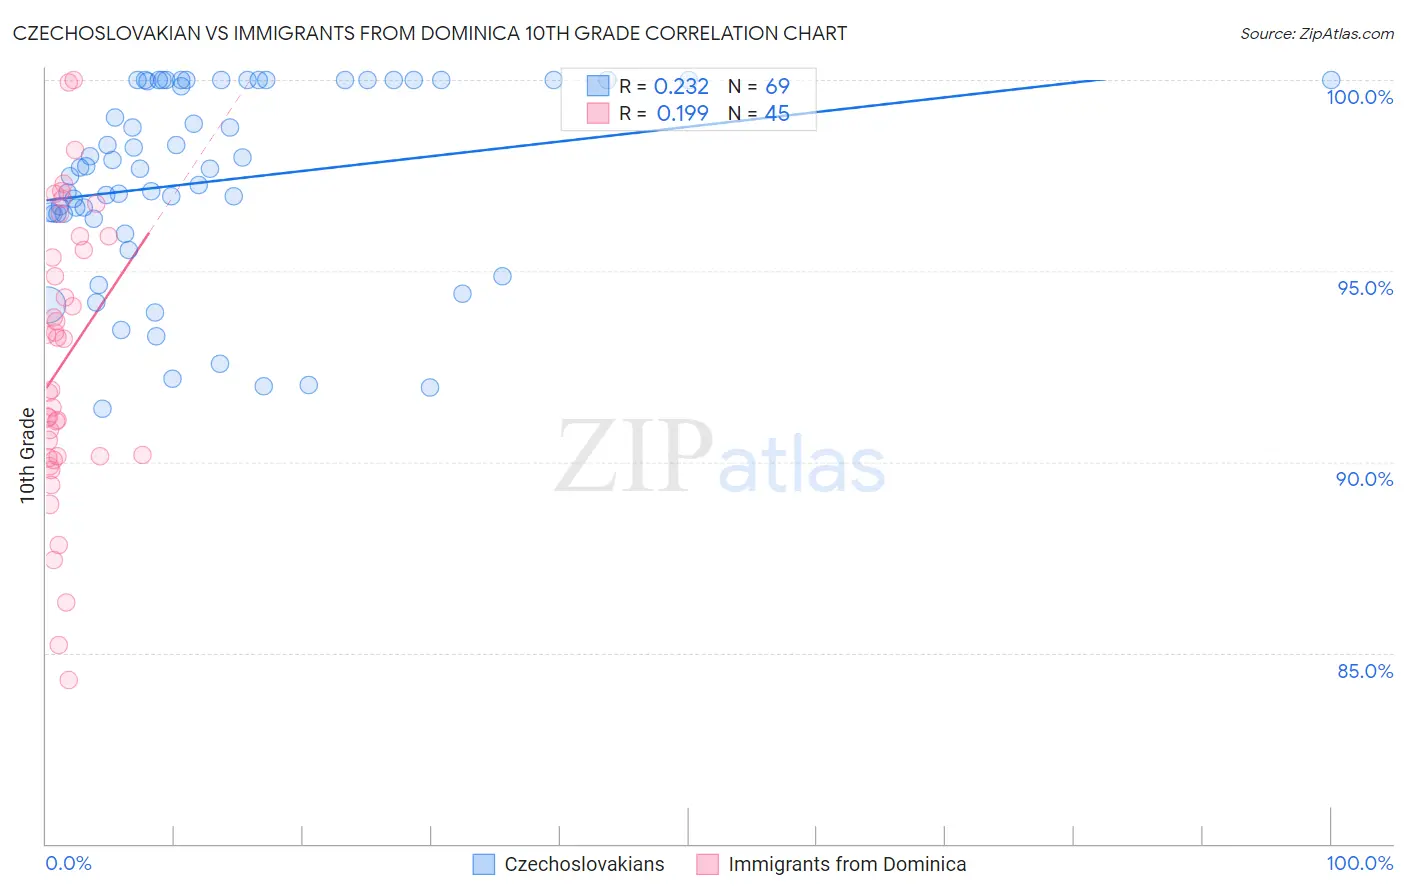
Czechoslovakian vs Immigrants from Dominica 10th Grade Correlation Chart
The statistical analysis conducted on geographies consisting of 368,668,876 people shows a weak positive correlation between the proportion of Czechoslovakians and percentage of population with at least 10th grade education in the United States with a correlation coefficient (R) of 0.232 and weighted average of 95.1%. Similarly, the statistical analysis conducted on geographies consisting of 83,794,115 people shows a poor positive correlation between the proportion of Immigrants from Dominica and percentage of population with at least 10th grade education in the United States with a correlation coefficient (R) of 0.199 and weighted average of 91.1%, a difference of 4.4%.
10th Grade Correlation Summary
| Measurement | Czechoslovakian | Immigrants from Dominica |
| Minimum | 91.4% | 84.3% |
| Maximum | 100.0% | 100.0% |
| Range | 8.6% | 15.7% |
| Mean | 97.4% | 92.6% |
| Median | 97.7% | 91.9% |
| Interquartile 25% (IQ1) | 96.4% | 90.1% |
| Interquartile 75% (IQ3) | 100.0% | 95.7% |
| Interquartile Range (IQR) | 3.6% | 5.6% |
| Standard Deviation (Sample) | 2.5% | 3.7% |
| Standard Deviation (Population) | 2.5% | 3.7% |
Similar Demographics by 10th Grade
Demographics Similar to Czechoslovakians by 10th Grade
In terms of 10th grade, the demographic groups most similar to Czechoslovakians are Immigrants from Northern Europe (95.2%, a difference of 0.010%), Greek (95.2%, a difference of 0.010%), Serbian (95.1%, a difference of 0.010%), Macedonian (95.2%, a difference of 0.020%), and Australian (95.1%, a difference of 0.020%).
| Demographics | Rating | Rank | 10th Grade |
| Immigrants | Scotland | 99.9 /100 | #39 | Exceptional 95.2% |
| Scotch-Irish | 99.9 /100 | #40 | Exceptional 95.2% |
| Russians | 99.9 /100 | #41 | Exceptional 95.2% |
| Slavs | 99.9 /100 | #42 | Exceptional 95.2% |
| Macedonians | 99.9 /100 | #43 | Exceptional 95.2% |
| Immigrants | Northern Europe | 99.9 /100 | #44 | Exceptional 95.2% |
| Greeks | 99.9 /100 | #45 | Exceptional 95.2% |
| Czechoslovakians | 99.9 /100 | #46 | Exceptional 95.1% |
| Serbians | 99.9 /100 | #47 | Exceptional 95.1% |
| Australians | 99.9 /100 | #48 | Exceptional 95.1% |
| Immigrants | Austria | 99.9 /100 | #49 | Exceptional 95.1% |
| Immigrants | Canada | 99.8 /100 | #50 | Exceptional 95.1% |
| Austrians | 99.8 /100 | #51 | Exceptional 95.1% |
| Ottawa | 99.8 /100 | #52 | Exceptional 95.1% |
| Immigrants | North America | 99.8 /100 | #53 | Exceptional 95.0% |
Demographics Similar to Immigrants from Dominica by 10th Grade
In terms of 10th grade, the demographic groups most similar to Immigrants from Dominica are Pima (91.2%, a difference of 0.020%), Yaqui (91.1%, a difference of 0.060%), Immigrants from Vietnam (91.2%, a difference of 0.070%), Immigrants from Guyana (91.2%, a difference of 0.090%), and Japanese (91.2%, a difference of 0.10%).
| Demographics | Rating | Rank | 10th Grade |
| Cubans | 0.0 /100 | #298 | Tragic 91.5% |
| Immigrants | Haiti | 0.0 /100 | #299 | Tragic 91.4% |
| Guyanese | 0.0 /100 | #300 | Tragic 91.4% |
| Japanese | 0.0 /100 | #301 | Tragic 91.2% |
| Immigrants | Guyana | 0.0 /100 | #302 | Tragic 91.2% |
| Immigrants | Vietnam | 0.0 /100 | #303 | Tragic 91.2% |
| Pima | 0.0 /100 | #304 | Tragic 91.2% |
| Immigrants | Dominica | 0.0 /100 | #305 | Tragic 91.1% |
| Yaqui | 0.0 /100 | #306 | Tragic 91.1% |
| Immigrants | Fiji | 0.0 /100 | #307 | Tragic 91.0% |
| Immigrants | Bangladesh | 0.0 /100 | #308 | Tragic 91.0% |
| Immigrants | Immigrants | 0.0 /100 | #309 | Tragic 91.0% |
| Vietnamese | 0.0 /100 | #310 | Tragic 90.9% |
| Immigrants | Cambodia | 0.0 /100 | #311 | Tragic 90.9% |
| Immigrants | Portugal | 0.0 /100 | #312 | Tragic 90.8% |