Czechoslovakian vs Immigrants from Burma/Myanmar Master's Degree
COMPARE
Czechoslovakian
Immigrants from Burma/Myanmar
Master's Degree
Master's Degree Comparison
Czechoslovakians
Immigrants from Burma/Myanmar
14.5%
MASTER'S DEGREE
29.9/ 100
METRIC RATING
196th/ 347
METRIC RANK
13.5%
MASTER'S DEGREE
5.0/ 100
METRIC RATING
234th/ 347
METRIC RANK
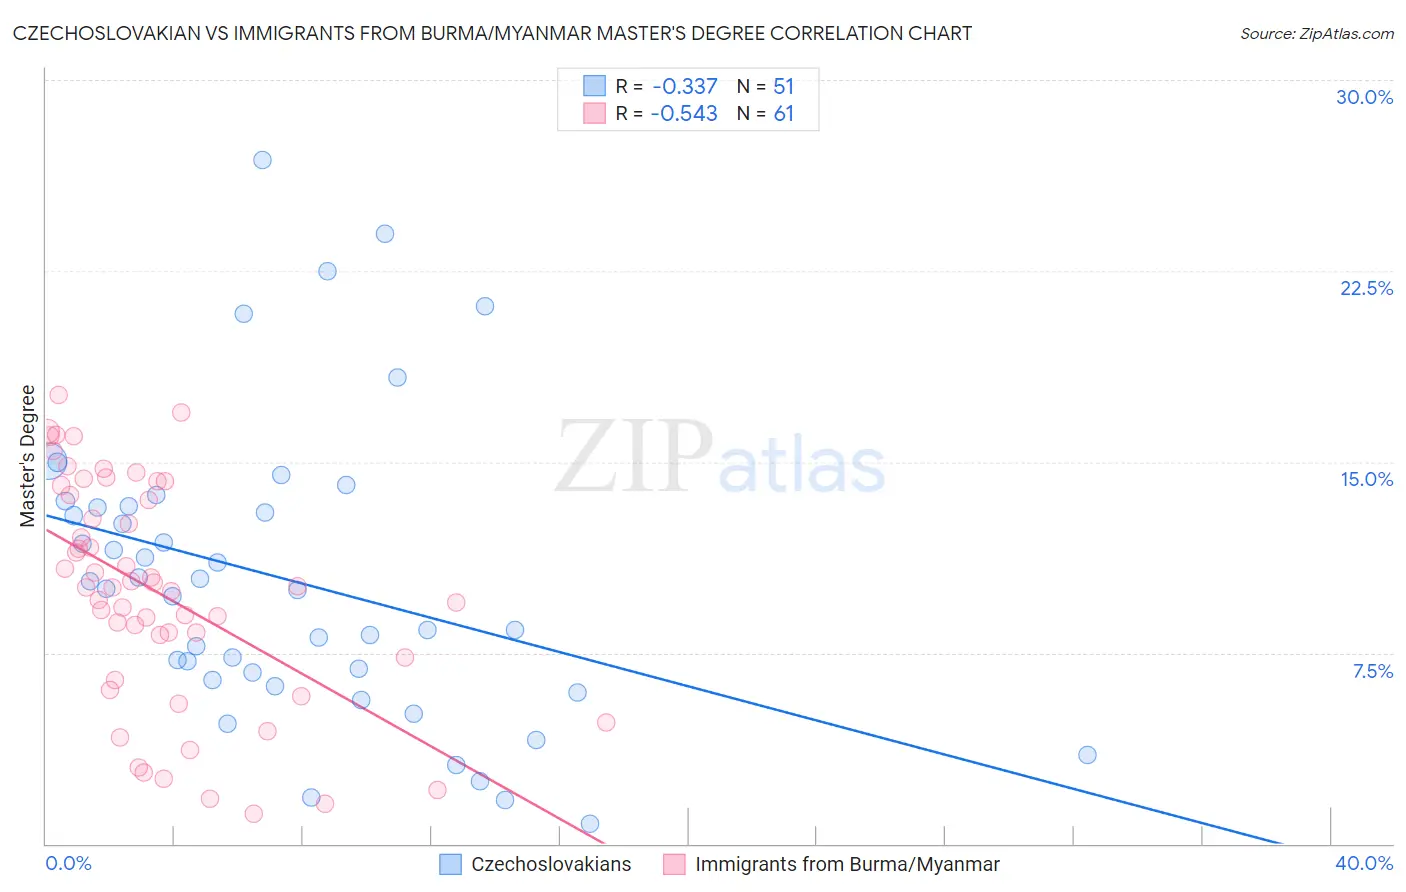
Czechoslovakian vs Immigrants from Burma/Myanmar Master's Degree Correlation Chart
The statistical analysis conducted on geographies consisting of 368,562,573 people shows a mild negative correlation between the proportion of Czechoslovakians and percentage of population with at least master's degree education in the United States with a correlation coefficient (R) of -0.337 and weighted average of 14.5%. Similarly, the statistical analysis conducted on geographies consisting of 172,302,674 people shows a substantial negative correlation between the proportion of Immigrants from Burma/Myanmar and percentage of population with at least master's degree education in the United States with a correlation coefficient (R) of -0.543 and weighted average of 13.5%, a difference of 7.4%.
Master's Degree Correlation Summary
| Measurement | Czechoslovakian | Immigrants from Burma/Myanmar |
| Minimum | 0.78% | 1.2% |
| Maximum | 26.9% | 17.6% |
| Range | 26.1% | 16.5% |
| Mean | 10.4% | 9.9% |
| Median | 10.0% | 10.1% |
| Interquartile 25% (IQ1) | 6.4% | 6.9% |
| Interquartile 75% (IQ3) | 13.3% | 13.9% |
| Interquartile Range (IQR) | 6.8% | 7.0% |
| Standard Deviation (Sample) | 5.8% | 4.4% |
| Standard Deviation (Population) | 5.7% | 4.3% |
Similar Demographics by Master's Degree
Demographics Similar to Czechoslovakians by Master's Degree
In terms of master's degree, the demographic groups most similar to Czechoslovakians are Danish (14.5%, a difference of 0.22%), Belgian (14.5%, a difference of 0.31%), Chinese (14.6%, a difference of 0.39%), West Indian (14.5%, a difference of 0.41%), and Immigrants from Nigeria (14.6%, a difference of 0.43%).
| Demographics | Rating | Rank | Master's Degree |
| Immigrants | Immigrants | 36.0 /100 | #189 | Fair 14.6% |
| Spaniards | 35.8 /100 | #190 | Fair 14.6% |
| Welsh | 34.2 /100 | #191 | Fair 14.6% |
| Immigrants | Middle Africa | 33.6 /100 | #192 | Fair 14.6% |
| Immigrants | Nigeria | 32.7 /100 | #193 | Fair 14.6% |
| Chinese | 32.5 /100 | #194 | Fair 14.6% |
| Danes | 31.3 /100 | #195 | Fair 14.5% |
| Czechoslovakians | 29.9 /100 | #196 | Fair 14.5% |
| Belgians | 28.0 /100 | #197 | Fair 14.5% |
| West Indians | 27.4 /100 | #198 | Fair 14.5% |
| Immigrants | Armenia | 27.2 /100 | #199 | Fair 14.5% |
| Panamanians | 25.1 /100 | #200 | Fair 14.4% |
| Scotch-Irish | 25.0 /100 | #201 | Fair 14.4% |
| Immigrants | Western Africa | 24.9 /100 | #202 | Fair 14.4% |
| Yugoslavians | 24.3 /100 | #203 | Fair 14.4% |
Demographics Similar to Immigrants from Burma/Myanmar by Master's Degree
In terms of master's degree, the demographic groups most similar to Immigrants from Burma/Myanmar are German Russian (13.5%, a difference of 0.41%), Immigrants from Ecuador (13.6%, a difference of 0.50%), Immigrants from Guyana (13.4%, a difference of 0.52%), Immigrants from Philippines (13.6%, a difference of 0.65%), and Jamaican (13.4%, a difference of 0.75%).
| Demographics | Rating | Rank | Master's Degree |
| Immigrants | West Indies | 9.8 /100 | #227 | Tragic 13.9% |
| Whites/Caucasians | 9.1 /100 | #228 | Tragic 13.8% |
| British West Indians | 8.8 /100 | #229 | Tragic 13.8% |
| Dutch | 8.7 /100 | #230 | Tragic 13.8% |
| Guyanese | 7.6 /100 | #231 | Tragic 13.7% |
| Immigrants | Philippines | 6.0 /100 | #232 | Tragic 13.6% |
| Immigrants | Ecuador | 5.7 /100 | #233 | Tragic 13.6% |
| Immigrants | Burma/Myanmar | 5.0 /100 | #234 | Tragic 13.5% |
| German Russians | 4.5 /100 | #235 | Tragic 13.5% |
| Immigrants | Guyana | 4.4 /100 | #236 | Tragic 13.4% |
| Jamaicans | 4.1 /100 | #237 | Tragic 13.4% |
| Hmong | 4.0 /100 | #238 | Tragic 13.4% |
| Immigrants | Nonimmigrants | 3.4 /100 | #239 | Tragic 13.3% |
| Guamanians/Chamorros | 2.2 /100 | #240 | Tragic 13.1% |
| U.S. Virgin Islanders | 2.1 /100 | #241 | Tragic 13.1% |