Czechoslovakian vs Kiowa Master's Degree
COMPARE
Czechoslovakian
Kiowa
Master's Degree
Master's Degree Comparison
Czechoslovakians
Kiowa
14.5%
MASTER'S DEGREE
29.9/ 100
METRIC RATING
196th/ 347
METRIC RANK
10.8%
MASTER'S DEGREE
0.0/ 100
METRIC RATING
319th/ 347
METRIC RANK
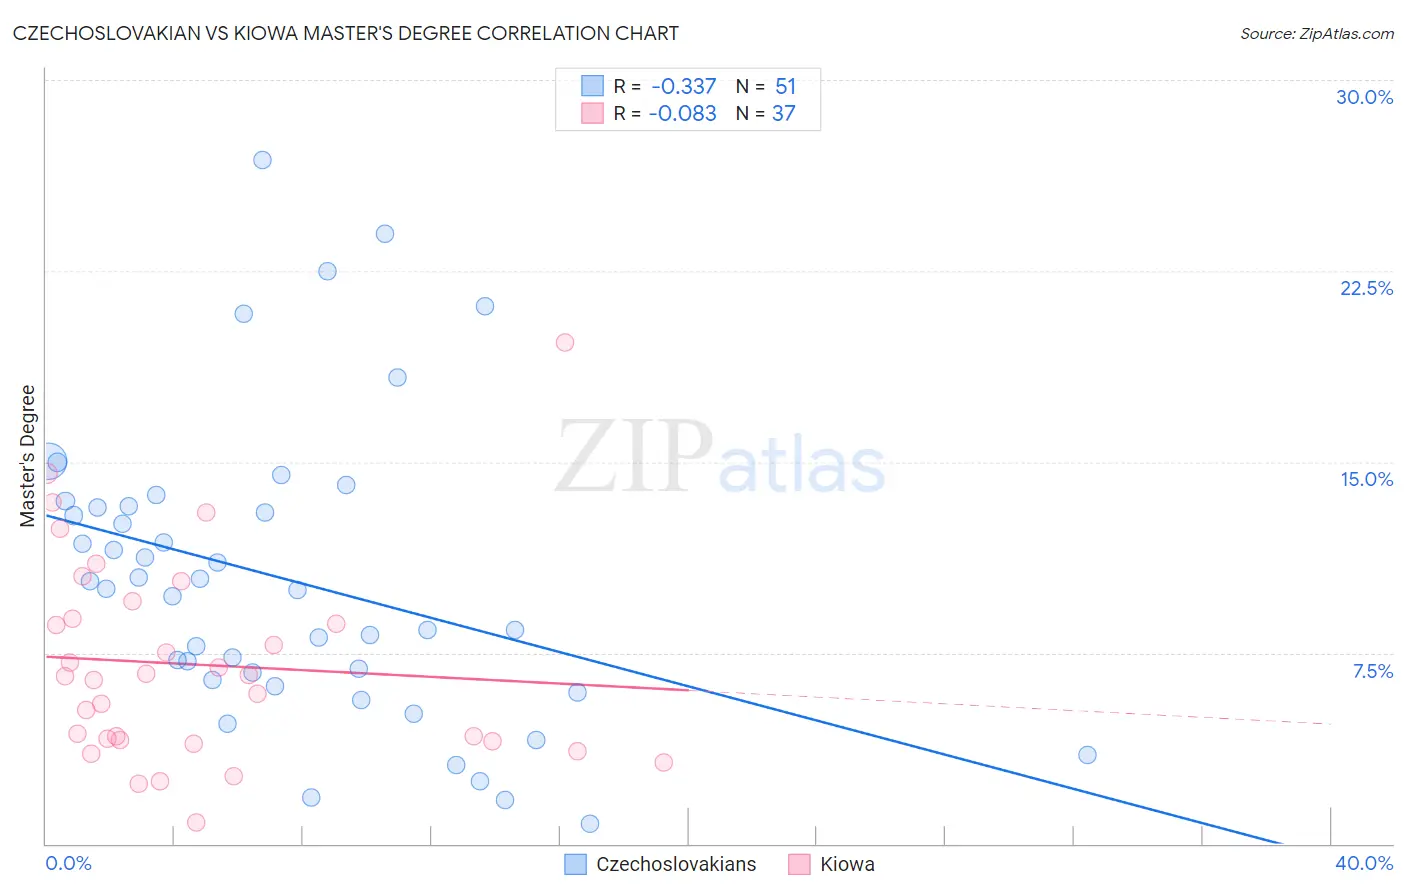
Czechoslovakian vs Kiowa Master's Degree Correlation Chart
The statistical analysis conducted on geographies consisting of 368,562,573 people shows a mild negative correlation between the proportion of Czechoslovakians and percentage of population with at least master's degree education in the United States with a correlation coefficient (R) of -0.337 and weighted average of 14.5%. Similarly, the statistical analysis conducted on geographies consisting of 56,098,690 people shows a slight negative correlation between the proportion of Kiowa and percentage of population with at least master's degree education in the United States with a correlation coefficient (R) of -0.083 and weighted average of 10.8%, a difference of 34.0%.
Master's Degree Correlation Summary
| Measurement | Czechoslovakian | Kiowa |
| Minimum | 0.78% | 0.84% |
| Maximum | 26.9% | 19.7% |
| Range | 26.1% | 18.9% |
| Mean | 10.4% | 7.0% |
| Median | 10.0% | 6.6% |
| Interquartile 25% (IQ1) | 6.4% | 4.1% |
| Interquartile 75% (IQ3) | 13.3% | 9.2% |
| Interquartile Range (IQR) | 6.8% | 5.1% |
| Standard Deviation (Sample) | 5.8% | 4.0% |
| Standard Deviation (Population) | 5.7% | 4.0% |
Similar Demographics by Master's Degree
Demographics Similar to Czechoslovakians by Master's Degree
In terms of master's degree, the demographic groups most similar to Czechoslovakians are Danish (14.5%, a difference of 0.22%), Belgian (14.5%, a difference of 0.31%), Chinese (14.6%, a difference of 0.39%), West Indian (14.5%, a difference of 0.41%), and Immigrants from Nigeria (14.6%, a difference of 0.43%).
| Demographics | Rating | Rank | Master's Degree |
| Immigrants | Immigrants | 36.0 /100 | #189 | Fair 14.6% |
| Spaniards | 35.8 /100 | #190 | Fair 14.6% |
| Welsh | 34.2 /100 | #191 | Fair 14.6% |
| Immigrants | Middle Africa | 33.6 /100 | #192 | Fair 14.6% |
| Immigrants | Nigeria | 32.7 /100 | #193 | Fair 14.6% |
| Chinese | 32.5 /100 | #194 | Fair 14.6% |
| Danes | 31.3 /100 | #195 | Fair 14.5% |
| Czechoslovakians | 29.9 /100 | #196 | Fair 14.5% |
| Belgians | 28.0 /100 | #197 | Fair 14.5% |
| West Indians | 27.4 /100 | #198 | Fair 14.5% |
| Immigrants | Armenia | 27.2 /100 | #199 | Fair 14.5% |
| Panamanians | 25.1 /100 | #200 | Fair 14.4% |
| Scotch-Irish | 25.0 /100 | #201 | Fair 14.4% |
| Immigrants | Western Africa | 24.9 /100 | #202 | Fair 14.4% |
| Yugoslavians | 24.3 /100 | #203 | Fair 14.4% |
Demographics Similar to Kiowa by Master's Degree
In terms of master's degree, the demographic groups most similar to Kiowa are Immigrants from Cuba (10.9%, a difference of 0.24%), Hopi (10.9%, a difference of 0.37%), Immigrants from Micronesia (10.8%, a difference of 0.62%), Pennsylvania German (10.7%, a difference of 0.83%), and Hispanic or Latino (10.9%, a difference of 0.91%).
| Demographics | Rating | Rank | Master's Degree |
| Choctaw | 0.0 /100 | #312 | Tragic 11.0% |
| Yaqui | 0.0 /100 | #313 | Tragic 11.0% |
| Cajuns | 0.0 /100 | #314 | Tragic 11.0% |
| Apache | 0.0 /100 | #315 | Tragic 11.0% |
| Hispanics or Latinos | 0.0 /100 | #316 | Tragic 10.9% |
| Hopi | 0.0 /100 | #317 | Tragic 10.9% |
| Immigrants | Cuba | 0.0 /100 | #318 | Tragic 10.9% |
| Kiowa | 0.0 /100 | #319 | Tragic 10.8% |
| Immigrants | Micronesia | 0.0 /100 | #320 | Tragic 10.8% |
| Pennsylvania Germans | 0.0 /100 | #321 | Tragic 10.7% |
| Sioux | 0.0 /100 | #322 | Tragic 10.7% |
| Crow | 0.0 /100 | #323 | Tragic 10.6% |
| Dutch West Indians | 0.0 /100 | #324 | Tragic 10.6% |
| Inupiat | 0.0 /100 | #325 | Tragic 10.5% |
| Creek | 0.0 /100 | #326 | Tragic 10.5% |