Immigrants from Eastern Asia vs Finnish Master's Degree
COMPARE
Immigrants from Eastern Asia
Finnish
Master's Degree
Master's Degree Comparison
Immigrants from Eastern Asia
Finns
20.8%
MASTER'S DEGREE
100.0/ 100
METRIC RATING
15th/ 347
METRIC RANK
14.2%
MASTER'S DEGREE
16.9/ 100
METRIC RATING
214th/ 347
METRIC RANK
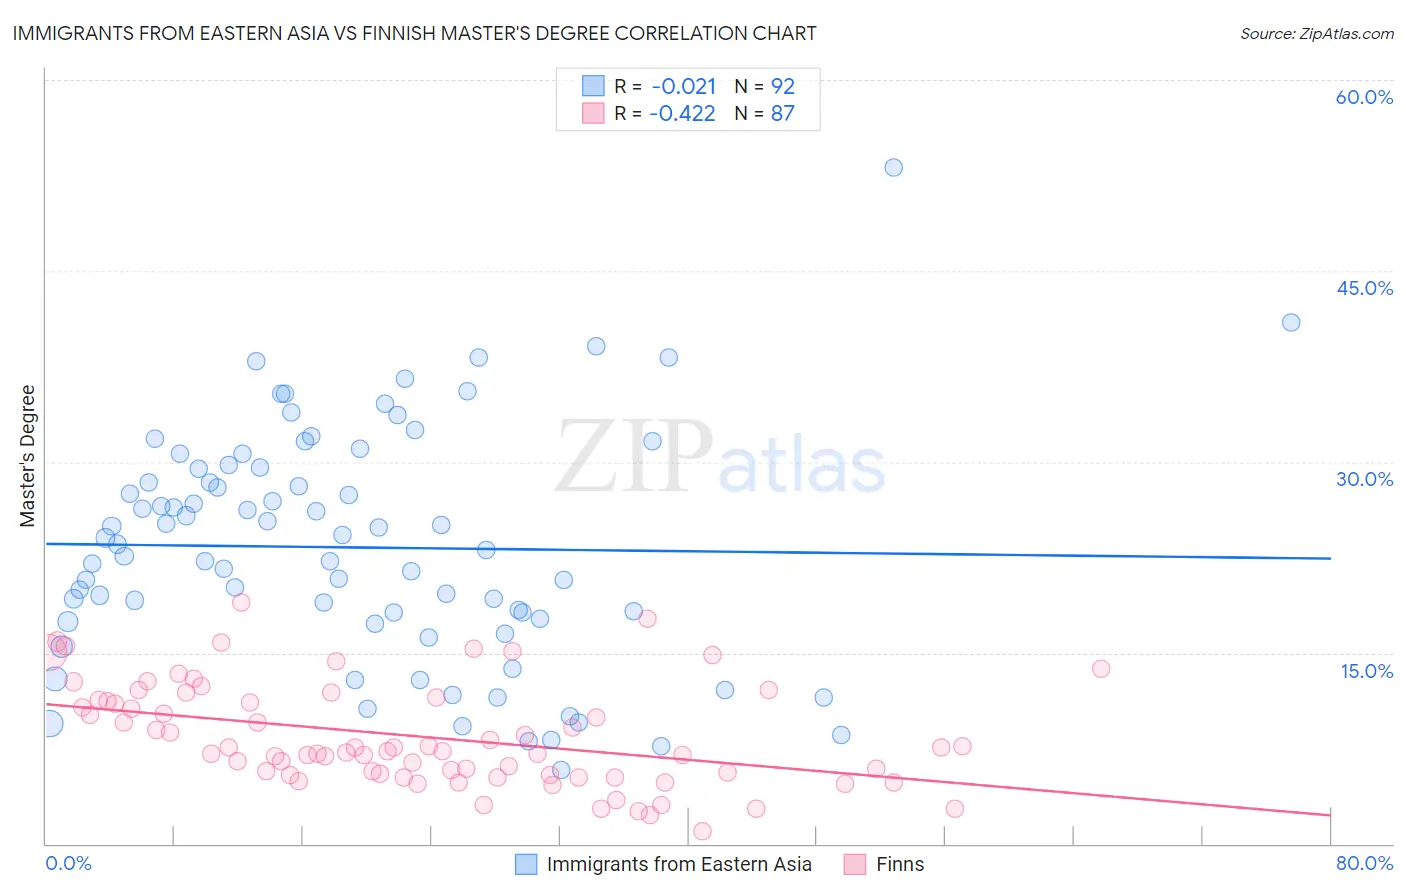
Immigrants from Eastern Asia vs Finnish Master's Degree Correlation Chart
The statistical analysis conducted on geographies consisting of 499,625,915 people shows no correlation between the proportion of Immigrants from Eastern Asia and percentage of population with at least master's degree education in the United States with a correlation coefficient (R) of -0.021 and weighted average of 20.8%. Similarly, the statistical analysis conducted on geographies consisting of 404,580,183 people shows a moderate negative correlation between the proportion of Finns and percentage of population with at least master's degree education in the United States with a correlation coefficient (R) of -0.422 and weighted average of 14.2%, a difference of 47.1%.
Master's Degree Correlation Summary
| Measurement | Immigrants from Eastern Asia | Finnish |
| Minimum | 5.8% | 1.0% |
| Maximum | 53.1% | 18.9% |
| Range | 47.3% | 17.9% |
| Mean | 23.3% | 8.4% |
| Median | 23.3% | 7.3% |
| Interquartile 25% (IQ1) | 17.6% | 5.4% |
| Interquartile 75% (IQ3) | 29.5% | 11.3% |
| Interquartile Range (IQR) | 11.9% | 5.8% |
| Standard Deviation (Sample) | 9.1% | 4.0% |
| Standard Deviation (Population) | 9.1% | 4.0% |
Similar Demographics by Master's Degree
Demographics Similar to Immigrants from Eastern Asia by Master's Degree
In terms of master's degree, the demographic groups most similar to Immigrants from Eastern Asia are Immigrants from Switzerland (20.9%, a difference of 0.18%), Immigrants from Australia (20.9%, a difference of 0.19%), Immigrants from Belgium (20.8%, a difference of 0.29%), Immigrants from South Central Asia (20.7%, a difference of 0.54%), and Eastern European (21.1%, a difference of 1.4%).
| Demographics | Rating | Rank | Master's Degree |
| Cypriots | 100.0 /100 | #8 | Exceptional 21.8% |
| Thais | 100.0 /100 | #9 | Exceptional 21.7% |
| Immigrants | Iran | 100.0 /100 | #10 | Exceptional 21.6% |
| Immigrants | China | 100.0 /100 | #11 | Exceptional 21.2% |
| Eastern Europeans | 100.0 /100 | #12 | Exceptional 21.1% |
| Immigrants | Australia | 100.0 /100 | #13 | Exceptional 20.9% |
| Immigrants | Switzerland | 100.0 /100 | #14 | Exceptional 20.9% |
| Immigrants | Eastern Asia | 100.0 /100 | #15 | Exceptional 20.8% |
| Immigrants | Belgium | 100.0 /100 | #16 | Exceptional 20.8% |
| Immigrants | South Central Asia | 100.0 /100 | #17 | Exceptional 20.7% |
| Soviet Union | 100.0 /100 | #18 | Exceptional 20.5% |
| Immigrants | Hong Kong | 100.0 /100 | #19 | Exceptional 20.5% |
| Indians (Asian) | 100.0 /100 | #20 | Exceptional 20.5% |
| Immigrants | Ireland | 100.0 /100 | #21 | Exceptional 20.4% |
| Israelis | 100.0 /100 | #22 | Exceptional 20.3% |
Demographics Similar to Finns by Master's Degree
In terms of master's degree, the demographic groups most similar to Finns are Immigrants from Thailand (14.2%, a difference of 0.010%), Spanish (14.2%, a difference of 0.20%), Immigrants from Vietnam (14.1%, a difference of 0.21%), Somali (14.2%, a difference of 0.25%), and Immigrants from Somalia (14.1%, a difference of 0.27%).
| Demographics | Rating | Rank | Master's Degree |
| Immigrants | Bosnia and Herzegovina | 22.0 /100 | #207 | Fair 14.3% |
| Immigrants | Barbados | 20.5 /100 | #208 | Fair 14.3% |
| Immigrants | Panama | 20.0 /100 | #209 | Fair 14.3% |
| Sub-Saharan Africans | 19.4 /100 | #210 | Poor 14.2% |
| Somalis | 18.0 /100 | #211 | Poor 14.2% |
| Spanish | 17.8 /100 | #212 | Poor 14.2% |
| Immigrants | Thailand | 17.0 /100 | #213 | Poor 14.2% |
| Finns | 16.9 /100 | #214 | Poor 14.2% |
| Immigrants | Vietnam | 16.1 /100 | #215 | Poor 14.1% |
| Immigrants | Somalia | 15.8 /100 | #216 | Poor 14.1% |
| Immigrants | Trinidad and Tobago | 15.8 /100 | #217 | Poor 14.1% |
| French Canadians | 14.9 /100 | #218 | Poor 14.1% |
| Norwegians | 13.6 /100 | #219 | Poor 14.0% |
| Germans | 13.1 /100 | #220 | Poor 14.0% |
| Koreans | 12.7 /100 | #221 | Poor 14.0% |