Immigrants from Hong Kong vs Sri Lankan No Schooling Completed
COMPARE
Immigrants from Hong Kong
Sri Lankan
No Schooling Completed
No Schooling Completed Comparison
Immigrants from Hong Kong
Sri Lankans
2.7%
NO SCHOOLING COMPLETED
0.0/ 100
METRIC RATING
290th/ 347
METRIC RANK
3.0%
NO SCHOOLING COMPLETED
0.0/ 100
METRIC RATING
312th/ 347
METRIC RANK
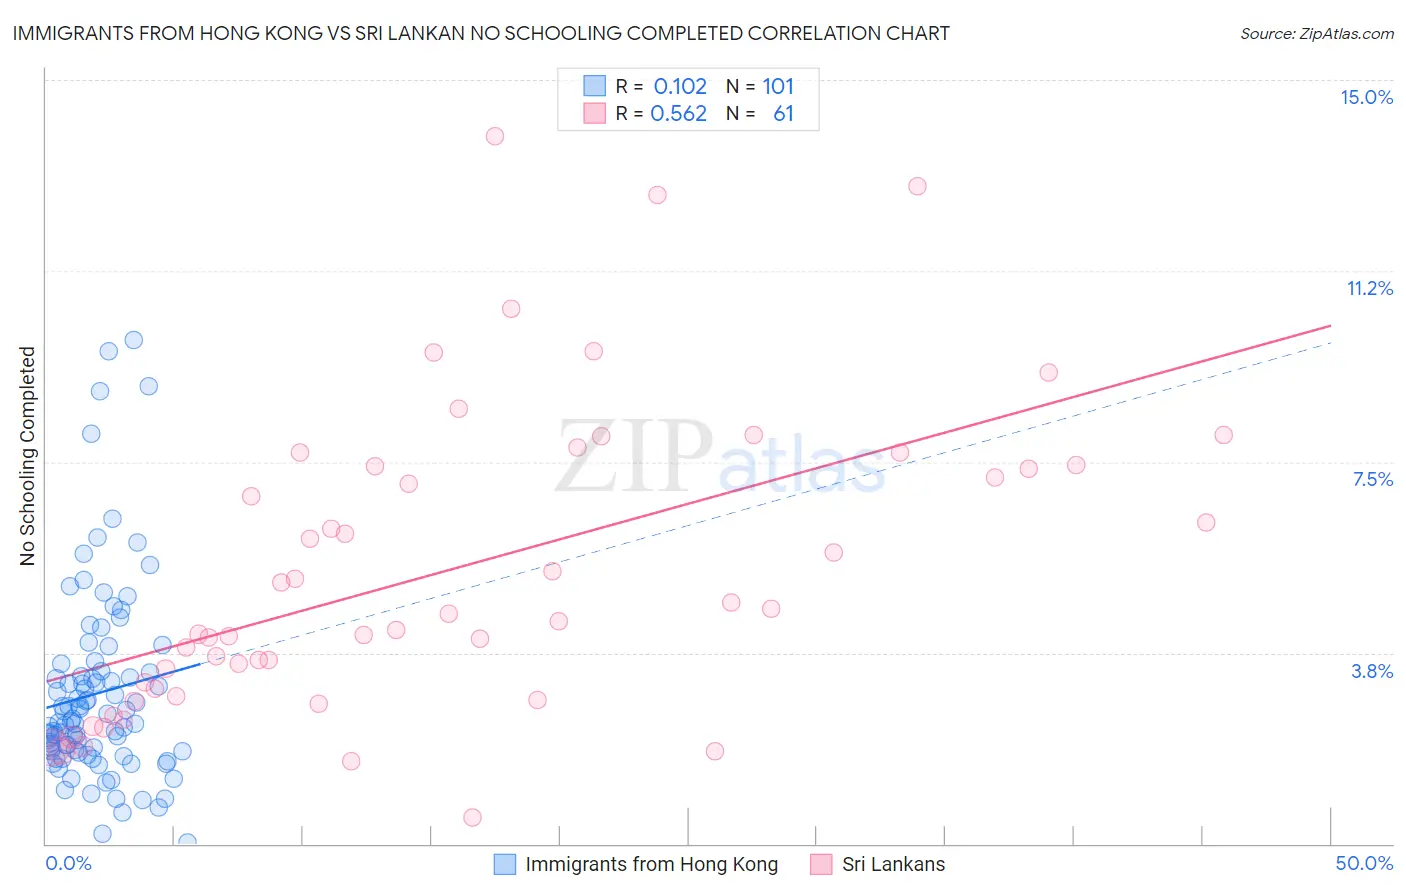
Immigrants from Hong Kong vs Sri Lankan No Schooling Completed Correlation Chart
The statistical analysis conducted on geographies consisting of 252,436,459 people shows a poor positive correlation between the proportion of Immigrants from Hong Kong and percentage of population with no schooling in the United States with a correlation coefficient (R) of 0.102 and weighted average of 2.7%. Similarly, the statistical analysis conducted on geographies consisting of 436,055,968 people shows a substantial positive correlation between the proportion of Sri Lankans and percentage of population with no schooling in the United States with a correlation coefficient (R) of 0.562 and weighted average of 3.0%, a difference of 12.8%.
No Schooling Completed Correlation Summary
| Measurement | Immigrants from Hong Kong | Sri Lankan |
| Minimum | 0.020% | 0.51% |
| Maximum | 9.9% | 13.9% |
| Range | 9.9% | 13.4% |
| Mean | 3.0% | 5.4% |
| Median | 2.4% | 4.5% |
| Interquartile 25% (IQ1) | 1.8% | 3.0% |
| Interquartile 75% (IQ3) | 3.4% | 7.4% |
| Interquartile Range (IQR) | 1.6% | 4.5% |
| Standard Deviation (Sample) | 1.9% | 3.0% |
| Standard Deviation (Population) | 1.9% | 3.0% |
Similar Demographics by No Schooling Completed
Demographics Similar to Immigrants from Hong Kong by No Schooling Completed
In terms of no schooling completed, the demographic groups most similar to Immigrants from Hong Kong are Immigrants from Thailand (2.7%, a difference of 0.060%), Immigrants from St. Vincent and the Grenadines (2.7%, a difference of 0.38%), Immigrants from Afghanistan (2.7%, a difference of 0.48%), British West Indian (2.7%, a difference of 0.89%), and Immigrants from Portugal (2.7%, a difference of 1.3%).
| Demographics | Rating | Rank | No Schooling Completed |
| Immigrants | Trinidad and Tobago | 0.0 /100 | #283 | Tragic 2.6% |
| Immigrants | West Indies | 0.0 /100 | #284 | Tragic 2.7% |
| Immigrants | Barbados | 0.0 /100 | #285 | Tragic 2.7% |
| Immigrants | Portugal | 0.0 /100 | #286 | Tragic 2.7% |
| Immigrants | Afghanistan | 0.0 /100 | #287 | Tragic 2.7% |
| Immigrants | St. Vincent and the Grenadines | 0.0 /100 | #288 | Tragic 2.7% |
| Immigrants | Thailand | 0.0 /100 | #289 | Tragic 2.7% |
| Immigrants | Hong Kong | 0.0 /100 | #290 | Tragic 2.7% |
| British West Indians | 0.0 /100 | #291 | Tragic 2.7% |
| Immigrants | Grenada | 0.0 /100 | #292 | Tragic 2.8% |
| Malaysians | 0.0 /100 | #293 | Tragic 2.8% |
| Immigrants | Eritrea | 0.0 /100 | #294 | Tragic 2.8% |
| Houma | 0.0 /100 | #295 | Tragic 2.8% |
| Immigrants | Immigrants | 0.0 /100 | #296 | Tragic 2.8% |
| Immigrants | Cuba | 0.0 /100 | #297 | Tragic 2.8% |
Demographics Similar to Sri Lankans by No Schooling Completed
In terms of no schooling completed, the demographic groups most similar to Sri Lankans are Immigrants from the Azores (3.0%, a difference of 0.28%), Guyanese (3.0%, a difference of 0.38%), Hispanic or Latino (3.0%, a difference of 0.43%), Honduran (3.1%, a difference of 0.51%), and Immigrants from Belize (3.1%, a difference of 0.60%).
| Demographics | Rating | Rank | No Schooling Completed |
| Ecuadorians | 0.0 /100 | #305 | Tragic 3.0% |
| Belizeans | 0.0 /100 | #306 | Tragic 3.0% |
| Immigrants | Haiti | 0.0 /100 | #307 | Tragic 3.0% |
| Immigrants | Somalia | 0.0 /100 | #308 | Tragic 3.0% |
| Hispanics or Latinos | 0.0 /100 | #309 | Tragic 3.0% |
| Guyanese | 0.0 /100 | #310 | Tragic 3.0% |
| Immigrants | Azores | 0.0 /100 | #311 | Tragic 3.0% |
| Sri Lankans | 0.0 /100 | #312 | Tragic 3.0% |
| Hondurans | 0.0 /100 | #313 | Tragic 3.1% |
| Immigrants | Belize | 0.0 /100 | #314 | Tragic 3.1% |
| Immigrants | Nicaragua | 0.0 /100 | #315 | Tragic 3.1% |
| Immigrants | Ecuador | 0.0 /100 | #316 | Tragic 3.1% |
| Cape Verdeans | 0.0 /100 | #317 | Tragic 3.1% |
| Immigrants | Guyana | 0.0 /100 | #318 | Tragic 3.1% |
| Immigrants | Burma/Myanmar | 0.0 /100 | #319 | Tragic 3.1% |