Crow vs Navajo No Schooling Completed
COMPARE
Crow
Navajo
No Schooling Completed
No Schooling Completed Comparison
Crow
Navajo
1.6%
NO SCHOOLING COMPLETED
99.8/ 100
METRIC RATING
54th/ 347
METRIC RANK
2.1%
NO SCHOOLING COMPLETED
36.5/ 100
METRIC RATING
187th/ 347
METRIC RANK
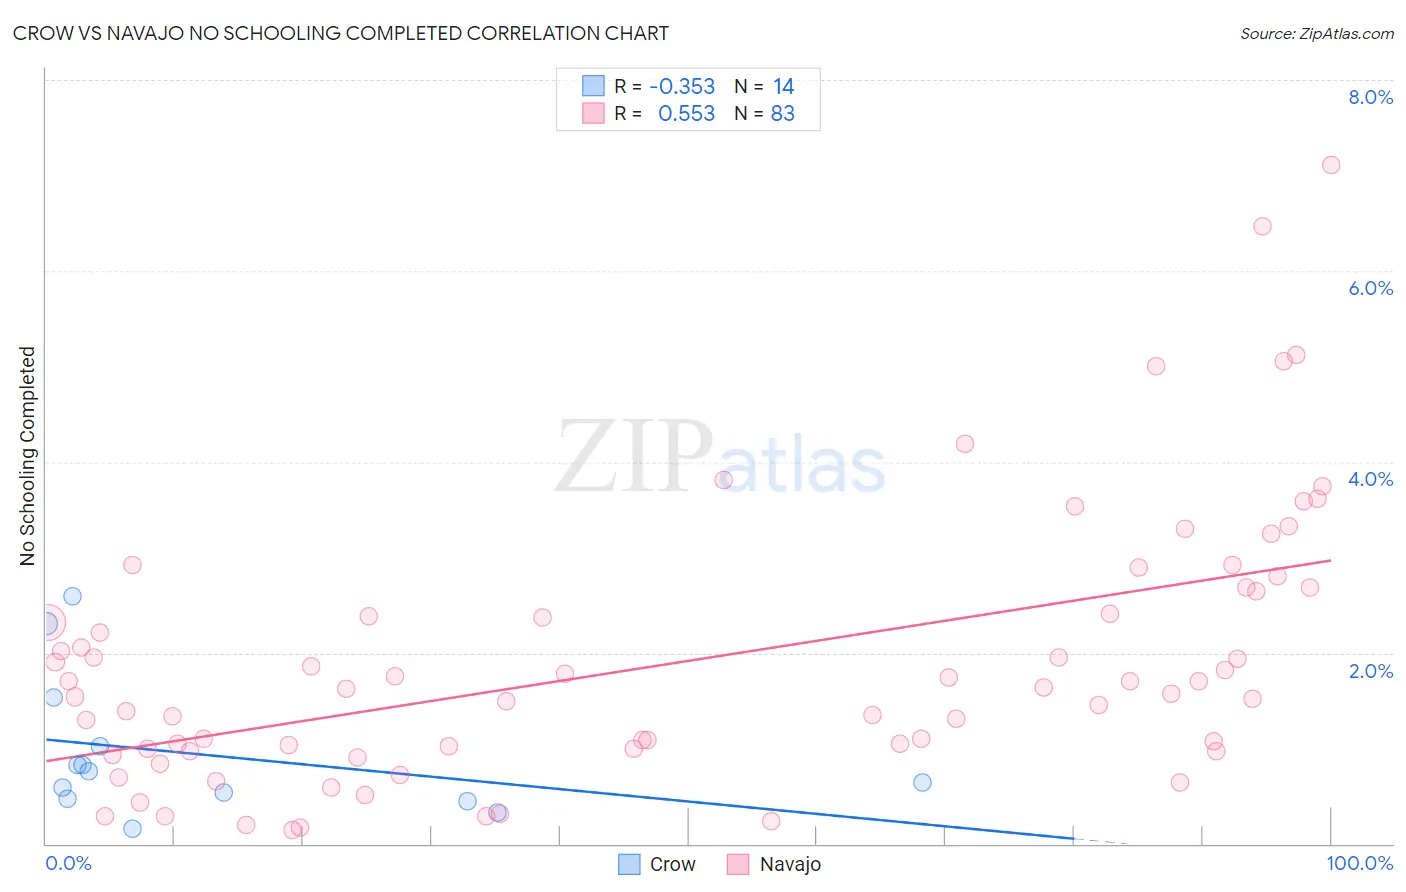
Crow vs Navajo No Schooling Completed Correlation Chart
The statistical analysis conducted on geographies consisting of 58,922,127 people shows a mild negative correlation between the proportion of Crow and percentage of population with no schooling in the United States with a correlation coefficient (R) of -0.353 and weighted average of 1.6%. Similarly, the statistical analysis conducted on geographies consisting of 223,187,945 people shows a substantial positive correlation between the proportion of Navajo and percentage of population with no schooling in the United States with a correlation coefficient (R) of 0.553 and weighted average of 2.1%, a difference of 29.9%.
No Schooling Completed Correlation Summary
| Measurement | Crow | Navajo |
| Minimum | 0.16% | 0.14% |
| Maximum | 2.6% | 7.1% |
| Range | 2.4% | 7.0% |
| Mean | 0.93% | 1.9% |
| Median | 0.70% | 1.6% |
| Interquartile 25% (IQ1) | 0.47% | 0.99% |
| Interquartile 75% (IQ3) | 1.0% | 2.6% |
| Interquartile Range (IQR) | 0.55% | 1.7% |
| Standard Deviation (Sample) | 0.73% | 1.4% |
| Standard Deviation (Population) | 0.70% | 1.4% |
Similar Demographics by No Schooling Completed
Demographics Similar to Crow by No Schooling Completed
In terms of no schooling completed, the demographic groups most similar to Crow are Creek (1.6%, a difference of 0.030%), Greek (1.6%, a difference of 0.12%), Immigrants from North America (1.6%, a difference of 0.12%), Immigrants from Canada (1.6%, a difference of 0.16%), and Chippewa (1.6%, a difference of 0.23%).
| Demographics | Rating | Rank | No Schooling Completed |
| Ottawa | 99.9 /100 | #47 | Exceptional 1.6% |
| Immigrants | Scotland | 99.9 /100 | #48 | Exceptional 1.6% |
| Whites/Caucasians | 99.9 /100 | #49 | Exceptional 1.6% |
| Celtics | 99.9 /100 | #50 | Exceptional 1.6% |
| Chippewa | 99.8 /100 | #51 | Exceptional 1.6% |
| Immigrants | Canada | 99.8 /100 | #52 | Exceptional 1.6% |
| Creek | 99.8 /100 | #53 | Exceptional 1.6% |
| Crow | 99.8 /100 | #54 | Exceptional 1.6% |
| Greeks | 99.8 /100 | #55 | Exceptional 1.6% |
| Immigrants | North America | 99.8 /100 | #56 | Exceptional 1.6% |
| Austrians | 99.8 /100 | #57 | Exceptional 1.6% |
| Kiowa | 99.8 /100 | #58 | Exceptional 1.6% |
| Slavs | 99.8 /100 | #59 | Exceptional 1.7% |
| Americans | 99.8 /100 | #60 | Exceptional 1.7% |
| Tsimshian | 99.8 /100 | #61 | Exceptional 1.7% |
Demographics Similar to Navajo by No Schooling Completed
In terms of no schooling completed, the demographic groups most similar to Navajo are Immigrants from Kenya (2.1%, a difference of 0.050%), Immigrants from Egypt (2.1%, a difference of 0.060%), Immigrants from Bosnia and Herzegovina (2.1%, a difference of 0.30%), Spanish American (2.1%, a difference of 0.57%), and Mongolian (2.1%, a difference of 0.60%).
| Demographics | Rating | Rank | No Schooling Completed |
| Portuguese | 43.9 /100 | #180 | Average 2.1% |
| Immigrants | Taiwan | 42.6 /100 | #181 | Average 2.1% |
| French American Indians | 42.2 /100 | #182 | Average 2.1% |
| Blacks/African Americans | 41.4 /100 | #183 | Average 2.1% |
| Pima | 41.3 /100 | #184 | Average 2.1% |
| Mongolians | 40.8 /100 | #185 | Average 2.1% |
| Immigrants | Bosnia and Herzegovina | 38.6 /100 | #186 | Fair 2.1% |
| Navajo | 36.5 /100 | #187 | Fair 2.1% |
| Immigrants | Kenya | 36.2 /100 | #188 | Fair 2.1% |
| Immigrants | Egypt | 36.1 /100 | #189 | Fair 2.1% |
| Spanish Americans | 32.6 /100 | #190 | Fair 2.1% |
| Bermudans | 30.7 /100 | #191 | Fair 2.1% |
| Guamanians/Chamorros | 29.8 /100 | #192 | Fair 2.2% |
| Paraguayans | 29.3 /100 | #193 | Fair 2.2% |
| Immigrants | Albania | 28.3 /100 | #194 | Fair 2.2% |