Cypriot vs Navajo Unemployment Among Ages 30 to 34 years
COMPARE
Cypriot
Navajo
Unemployment Among Ages 30 to 34 years
Unemployment Among Ages 30 to 34 years Comparison
Cypriots
Navajo
5.1%
UNEMPLOYMENT AMONG AGES 30 TO 34 YEARS
98.4/ 100
METRIC RATING
47th/ 347
METRIC RANK
10.6%
UNEMPLOYMENT AMONG AGES 30 TO 34 YEARS
0.0/ 100
METRIC RATING
341st/ 347
METRIC RANK
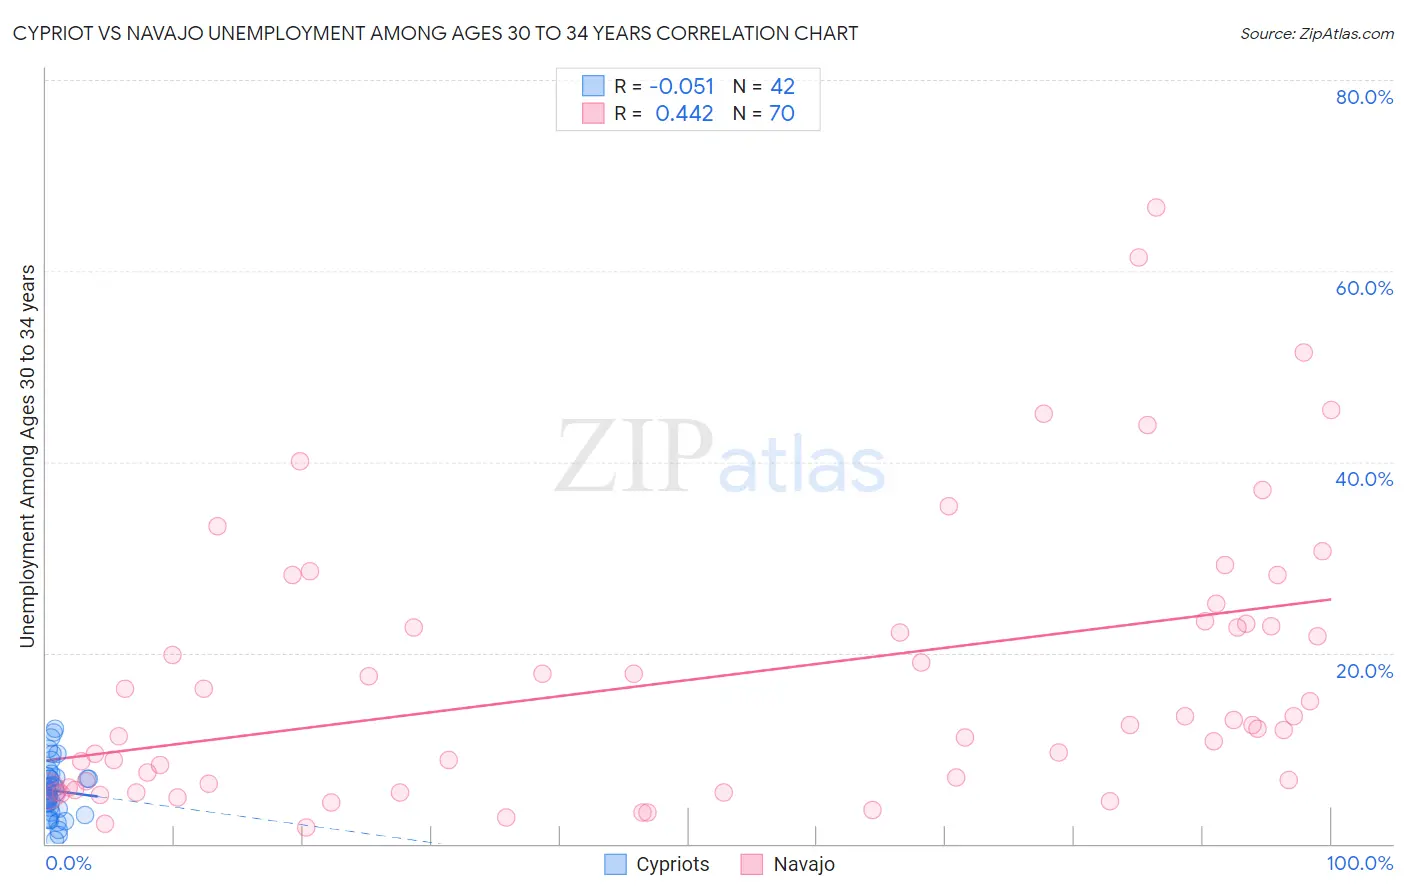
Cypriot vs Navajo Unemployment Among Ages 30 to 34 years Correlation Chart
The statistical analysis conducted on geographies consisting of 61,053,204 people shows a slight negative correlation between the proportion of Cypriots and unemployment rate among population between the ages 30 and 34 in the United States with a correlation coefficient (R) of -0.051 and weighted average of 5.1%. Similarly, the statistical analysis conducted on geographies consisting of 217,031,350 people shows a moderate positive correlation between the proportion of Navajo and unemployment rate among population between the ages 30 and 34 in the United States with a correlation coefficient (R) of 0.442 and weighted average of 10.6%, a difference of 108.1%.
Unemployment Among Ages 30 to 34 years Correlation Summary
| Measurement | Cypriot | Navajo |
| Minimum | 0.40% | 1.7% |
| Maximum | 12.0% | 66.7% |
| Range | 11.6% | 65.0% |
| Mean | 5.6% | 17.4% |
| Median | 5.3% | 12.5% |
| Interquartile 25% (IQ1) | 3.6% | 5.9% |
| Interquartile 75% (IQ3) | 6.9% | 23.1% |
| Interquartile Range (IQR) | 3.3% | 17.2% |
| Standard Deviation (Sample) | 2.8% | 14.5% |
| Standard Deviation (Population) | 2.8% | 14.4% |
Similar Demographics by Unemployment Among Ages 30 to 34 years
Demographics Similar to Cypriots by Unemployment Among Ages 30 to 34 years
In terms of unemployment among ages 30 to 34 years, the demographic groups most similar to Cypriots are Assyrian/Chaldean/Syriac (5.1%, a difference of 0.020%), Immigrants from Congo (5.1%, a difference of 0.030%), Immigrants from Malaysia (5.1%, a difference of 0.14%), Puget Sound Salish (5.1%, a difference of 0.21%), and Turkish (5.1%, a difference of 0.25%).
| Demographics | Rating | Rank | Unemployment Among Ages 30 to 34 years |
| Immigrants | Vietnam | 98.9 /100 | #40 | Exceptional 5.0% |
| Immigrants | Eastern Africa | 98.9 /100 | #41 | Exceptional 5.0% |
| Immigrants | Hong Kong | 98.8 /100 | #42 | Exceptional 5.0% |
| Soviet Union | 98.8 /100 | #43 | Exceptional 5.0% |
| Immigrants | Belgium | 98.7 /100 | #44 | Exceptional 5.1% |
| Yugoslavians | 98.6 /100 | #45 | Exceptional 5.1% |
| Immigrants | Congo | 98.4 /100 | #46 | Exceptional 5.1% |
| Cypriots | 98.4 /100 | #47 | Exceptional 5.1% |
| Assyrians/Chaldeans/Syriacs | 98.4 /100 | #48 | Exceptional 5.1% |
| Immigrants | Malaysia | 98.3 /100 | #49 | Exceptional 5.1% |
| Puget Sound Salish | 98.2 /100 | #50 | Exceptional 5.1% |
| Turks | 98.2 /100 | #51 | Exceptional 5.1% |
| Immigrants | Burma/Myanmar | 98.1 /100 | #52 | Exceptional 5.1% |
| Cubans | 98.1 /100 | #53 | Exceptional 5.1% |
| Immigrants | Morocco | 97.9 /100 | #54 | Exceptional 5.1% |
Demographics Similar to Navajo by Unemployment Among Ages 30 to 34 years
In terms of unemployment among ages 30 to 34 years, the demographic groups most similar to Navajo are Yuman (10.6%, a difference of 0.40%), Crow (10.3%, a difference of 2.0%), Inupiat (10.8%, a difference of 2.5%), Tohono O'odham (9.8%, a difference of 7.3%), and Yakama (9.8%, a difference of 8.1%).
| Demographics | Rating | Rank | Unemployment Among Ages 30 to 34 years |
| Pueblo | 0.0 /100 | #333 | Tragic 8.3% |
| Alaska Natives | 0.0 /100 | #334 | Tragic 8.5% |
| Puerto Ricans | 0.0 /100 | #335 | Tragic 8.9% |
| Colville | 0.0 /100 | #336 | Tragic 9.0% |
| Pima | 0.0 /100 | #337 | Tragic 9.6% |
| Yakama | 0.0 /100 | #338 | Tragic 9.8% |
| Tohono O'odham | 0.0 /100 | #339 | Tragic 9.8% |
| Crow | 0.0 /100 | #340 | Tragic 10.3% |
| Navajo | 0.0 /100 | #341 | Tragic 10.6% |
| Yuman | 0.0 /100 | #342 | Tragic 10.6% |
| Inupiat | 0.0 /100 | #343 | Tragic 10.8% |
| Hopi | 0.0 /100 | #344 | Tragic 11.9% |
| Arapaho | 0.0 /100 | #345 | Tragic 12.8% |
| Tsimshian | 0.0 /100 | #346 | Tragic 13.8% |
| Yup'ik | 0.0 /100 | #347 | Tragic 18.5% |