Swiss vs Navajo No Schooling Completed
COMPARE
Swiss
Navajo
No Schooling Completed
No Schooling Completed Comparison
Swiss
Navajo
1.5%
NO SCHOOLING COMPLETED
100.0/ 100
METRIC RATING
32nd/ 347
METRIC RANK
2.1%
NO SCHOOLING COMPLETED
36.5/ 100
METRIC RATING
187th/ 347
METRIC RANK
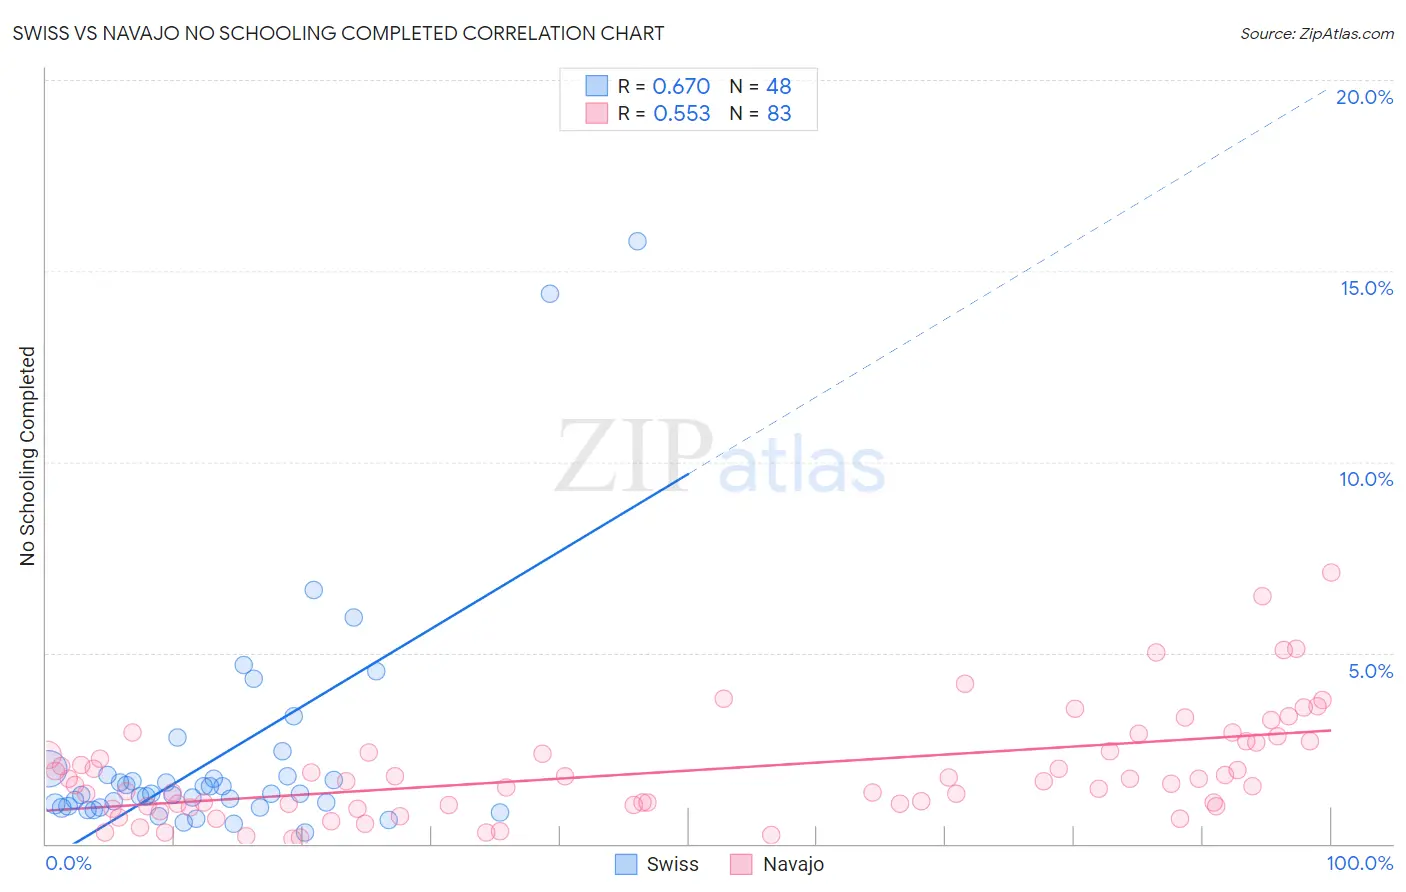
Swiss vs Navajo No Schooling Completed Correlation Chart
The statistical analysis conducted on geographies consisting of 455,291,102 people shows a significant positive correlation between the proportion of Swiss and percentage of population with no schooling in the United States with a correlation coefficient (R) of 0.670 and weighted average of 1.5%. Similarly, the statistical analysis conducted on geographies consisting of 223,187,945 people shows a substantial positive correlation between the proportion of Navajo and percentage of population with no schooling in the United States with a correlation coefficient (R) of 0.553 and weighted average of 2.1%, a difference of 39.4%.
No Schooling Completed Correlation Summary
| Measurement | Swiss | Navajo |
| Minimum | 0.31% | 0.14% |
| Maximum | 15.8% | 7.1% |
| Range | 15.5% | 7.0% |
| Mean | 2.3% | 1.9% |
| Median | 1.3% | 1.6% |
| Interquartile 25% (IQ1) | 0.97% | 0.99% |
| Interquartile 75% (IQ3) | 1.8% | 2.6% |
| Interquartile Range (IQR) | 0.82% | 1.7% |
| Standard Deviation (Sample) | 3.0% | 1.4% |
| Standard Deviation (Population) | 3.0% | 1.4% |
Similar Demographics by No Schooling Completed
Demographics Similar to Swiss by No Schooling Completed
In terms of no schooling completed, the demographic groups most similar to Swiss are Inupiat (1.5%, a difference of 0.39%), British (1.5%, a difference of 0.42%), Italian (1.5%, a difference of 0.68%), Lumbee (1.5%, a difference of 0.91%), and Latvian (1.5%, a difference of 0.94%).
| Demographics | Rating | Rank | No Schooling Completed |
| French | 100.0 /100 | #25 | Exceptional 1.5% |
| Czechs | 100.0 /100 | #26 | Exceptional 1.5% |
| Scandinavians | 100.0 /100 | #27 | Exceptional 1.5% |
| French Canadians | 100.0 /100 | #28 | Exceptional 1.5% |
| Lumbee | 100.0 /100 | #29 | Exceptional 1.5% |
| British | 100.0 /100 | #30 | Exceptional 1.5% |
| Inupiat | 100.0 /100 | #31 | Exceptional 1.5% |
| Swiss | 100.0 /100 | #32 | Exceptional 1.5% |
| Italians | 100.0 /100 | #33 | Exceptional 1.5% |
| Latvians | 100.0 /100 | #34 | Exceptional 1.5% |
| Eastern Europeans | 100.0 /100 | #35 | Exceptional 1.6% |
| Aleuts | 99.9 /100 | #36 | Exceptional 1.6% |
| Belgians | 99.9 /100 | #37 | Exceptional 1.6% |
| Northern Europeans | 99.9 /100 | #38 | Exceptional 1.6% |
| Native Hawaiians | 99.9 /100 | #39 | Exceptional 1.6% |
Demographics Similar to Navajo by No Schooling Completed
In terms of no schooling completed, the demographic groups most similar to Navajo are Immigrants from Kenya (2.1%, a difference of 0.050%), Immigrants from Egypt (2.1%, a difference of 0.060%), Immigrants from Bosnia and Herzegovina (2.1%, a difference of 0.30%), Spanish American (2.1%, a difference of 0.57%), and Mongolian (2.1%, a difference of 0.60%).
| Demographics | Rating | Rank | No Schooling Completed |
| Portuguese | 43.9 /100 | #180 | Average 2.1% |
| Immigrants | Taiwan | 42.6 /100 | #181 | Average 2.1% |
| French American Indians | 42.2 /100 | #182 | Average 2.1% |
| Blacks/African Americans | 41.4 /100 | #183 | Average 2.1% |
| Pima | 41.3 /100 | #184 | Average 2.1% |
| Mongolians | 40.8 /100 | #185 | Average 2.1% |
| Immigrants | Bosnia and Herzegovina | 38.6 /100 | #186 | Fair 2.1% |
| Navajo | 36.5 /100 | #187 | Fair 2.1% |
| Immigrants | Kenya | 36.2 /100 | #188 | Fair 2.1% |
| Immigrants | Egypt | 36.1 /100 | #189 | Fair 2.1% |
| Spanish Americans | 32.6 /100 | #190 | Fair 2.1% |
| Bermudans | 30.7 /100 | #191 | Fair 2.1% |
| Guamanians/Chamorros | 29.8 /100 | #192 | Fair 2.2% |
| Paraguayans | 29.3 /100 | #193 | Fair 2.2% |
| Immigrants | Albania | 28.3 /100 | #194 | Fair 2.2% |