Cypriot vs Potawatomi Master's Degree
COMPARE
Cypriot
Potawatomi
Master's Degree
Master's Degree Comparison
Cypriots
Potawatomi
21.8%
MASTER'S DEGREE
100.0/ 100
METRIC RATING
8th/ 347
METRIC RANK
12.1%
MASTER'S DEGREE
0.3/ 100
METRIC RATING
278th/ 347
METRIC RANK
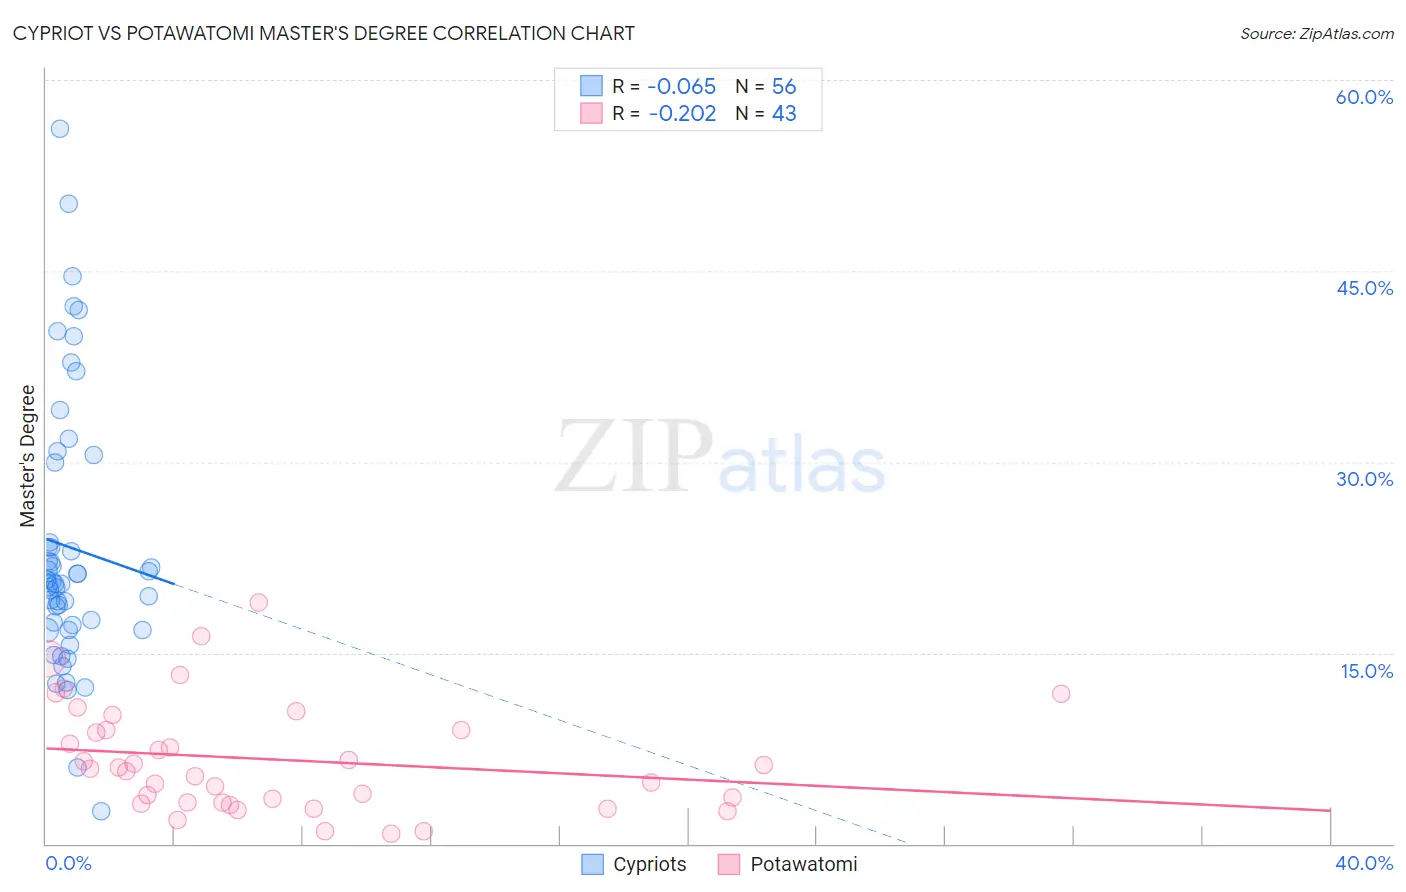
Cypriot vs Potawatomi Master's Degree Correlation Chart
The statistical analysis conducted on geographies consisting of 61,862,826 people shows a slight negative correlation between the proportion of Cypriots and percentage of population with at least master's degree education in the United States with a correlation coefficient (R) of -0.065 and weighted average of 21.8%. Similarly, the statistical analysis conducted on geographies consisting of 117,752,178 people shows a weak negative correlation between the proportion of Potawatomi and percentage of population with at least master's degree education in the United States with a correlation coefficient (R) of -0.202 and weighted average of 12.1%, a difference of 80.6%.
Master's Degree Correlation Summary
| Measurement | Cypriot | Potawatomi |
| Minimum | 2.5% | 0.76% |
| Maximum | 56.1% | 18.9% |
| Range | 53.6% | 18.1% |
| Mean | 23.3% | 6.6% |
| Median | 20.5% | 5.9% |
| Interquartile 25% (IQ1) | 17.0% | 3.2% |
| Interquartile 75% (IQ3) | 26.8% | 8.9% |
| Interquartile Range (IQR) | 9.8% | 5.7% |
| Standard Deviation (Sample) | 10.7% | 4.3% |
| Standard Deviation (Population) | 10.6% | 4.3% |
Similar Demographics by Master's Degree
Demographics Similar to Cypriots by Master's Degree
In terms of master's degree, the demographic groups most similar to Cypriots are Thai (21.7%, a difference of 0.34%), Immigrants from Iran (21.6%, a difference of 0.75%), Iranian (22.3%, a difference of 2.2%), Immigrants from India (22.3%, a difference of 2.4%), and Immigrants from China (21.2%, a difference of 2.9%).
| Demographics | Rating | Rank | Master's Degree |
| Immigrants | Singapore | 100.0 /100 | #1 | Exceptional 23.4% |
| Filipinos | 100.0 /100 | #2 | Exceptional 23.4% |
| Immigrants | Israel | 100.0 /100 | #3 | Exceptional 22.6% |
| Okinawans | 100.0 /100 | #4 | Exceptional 22.6% |
| Immigrants | Taiwan | 100.0 /100 | #5 | Exceptional 22.5% |
| Immigrants | India | 100.0 /100 | #6 | Exceptional 22.3% |
| Iranians | 100.0 /100 | #7 | Exceptional 22.3% |
| Cypriots | 100.0 /100 | #8 | Exceptional 21.8% |
| Thais | 100.0 /100 | #9 | Exceptional 21.7% |
| Immigrants | Iran | 100.0 /100 | #10 | Exceptional 21.6% |
| Immigrants | China | 100.0 /100 | #11 | Exceptional 21.2% |
| Eastern Europeans | 100.0 /100 | #12 | Exceptional 21.1% |
| Immigrants | Australia | 100.0 /100 | #13 | Exceptional 20.9% |
| Immigrants | Switzerland | 100.0 /100 | #14 | Exceptional 20.9% |
| Immigrants | Eastern Asia | 100.0 /100 | #15 | Exceptional 20.8% |
Demographics Similar to Potawatomi by Master's Degree
In terms of master's degree, the demographic groups most similar to Potawatomi are Immigrants from Caribbean (12.1%, a difference of 0.0%), Black/African American (12.1%, a difference of 0.010%), Cuban (12.1%, a difference of 0.070%), Cape Verdean (12.1%, a difference of 0.080%), and Immigrants from Belize (12.1%, a difference of 0.080%).
| Demographics | Rating | Rank | Master's Degree |
| Haitians | 0.3 /100 | #271 | Tragic 12.1% |
| Comanche | 0.3 /100 | #272 | Tragic 12.1% |
| Blackfeet | 0.3 /100 | #273 | Tragic 12.1% |
| Cape Verdeans | 0.3 /100 | #274 | Tragic 12.1% |
| Cubans | 0.3 /100 | #275 | Tragic 12.1% |
| Blacks/African Americans | 0.3 /100 | #276 | Tragic 12.1% |
| Immigrants | Caribbean | 0.3 /100 | #277 | Tragic 12.1% |
| Potawatomi | 0.3 /100 | #278 | Tragic 12.1% |
| Immigrants | Belize | 0.2 /100 | #279 | Tragic 12.1% |
| Immigrants | Dominican Republic | 0.2 /100 | #280 | Tragic 12.1% |
| Malaysians | 0.2 /100 | #281 | Tragic 12.0% |
| Immigrants | El Salvador | 0.2 /100 | #282 | Tragic 12.0% |
| Hondurans | 0.2 /100 | #283 | Tragic 11.9% |
| Ottawa | 0.2 /100 | #284 | Tragic 11.9% |
| Immigrants | Nicaragua | 0.2 /100 | #285 | Tragic 11.8% |