Cypriot vs Immigrants from Israel Master's Degree
COMPARE
Cypriot
Immigrants from Israel
Master's Degree
Master's Degree Comparison
Cypriots
Immigrants from Israel
21.8%
MASTER'S DEGREE
100.0/ 100
METRIC RATING
8th/ 347
METRIC RANK
22.6%
MASTER'S DEGREE
100.0/ 100
METRIC RATING
3rd/ 347
METRIC RANK
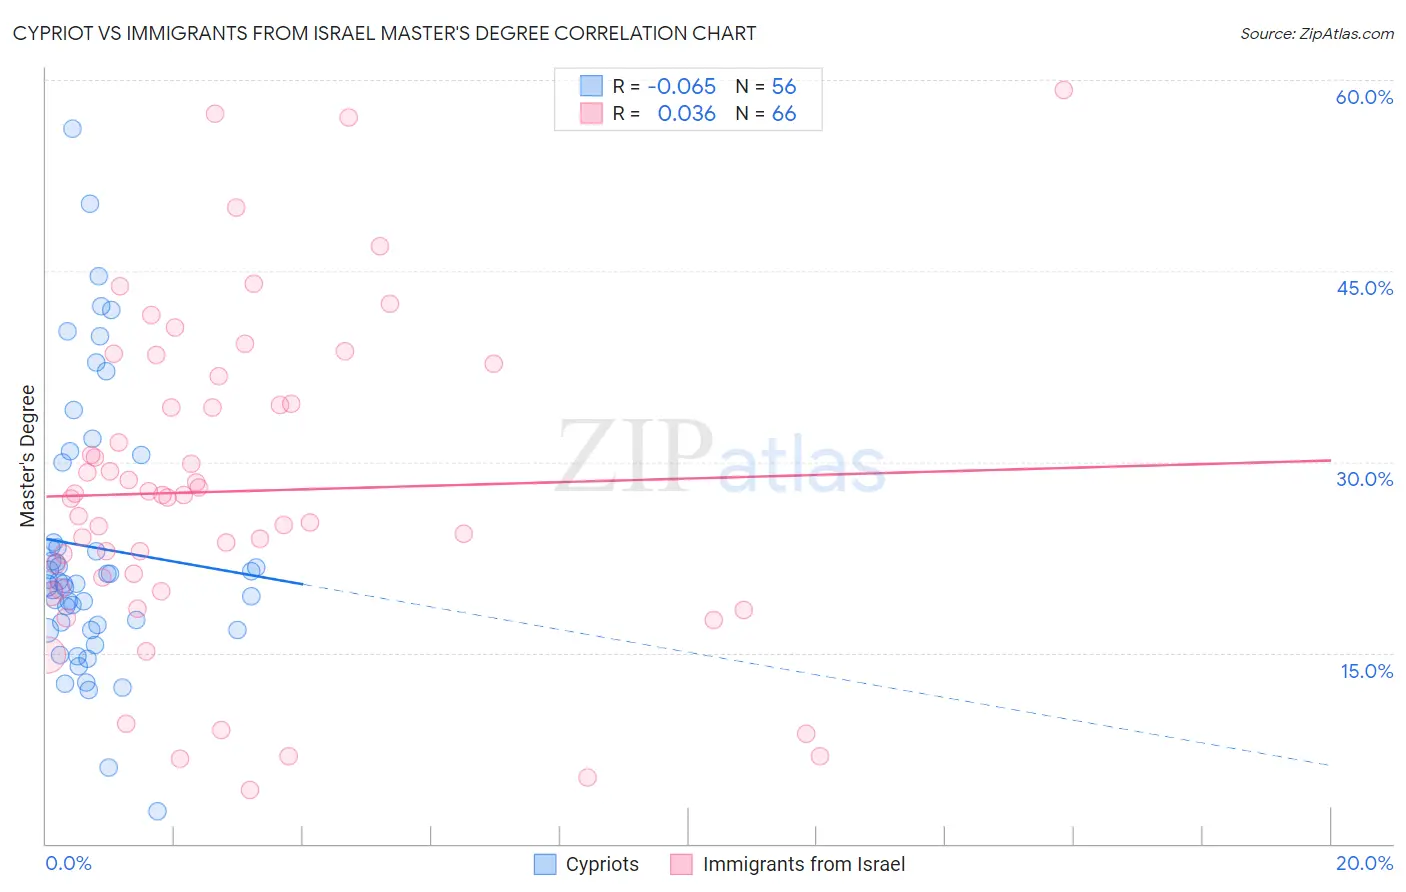
Cypriot vs Immigrants from Israel Master's Degree Correlation Chart
The statistical analysis conducted on geographies consisting of 61,862,826 people shows a slight negative correlation between the proportion of Cypriots and percentage of population with at least master's degree education in the United States with a correlation coefficient (R) of -0.065 and weighted average of 21.8%. Similarly, the statistical analysis conducted on geographies consisting of 210,015,600 people shows no correlation between the proportion of Immigrants from Israel and percentage of population with at least master's degree education in the United States with a correlation coefficient (R) of 0.036 and weighted average of 22.6%, a difference of 3.9%.
Master's Degree Correlation Summary
| Measurement | Cypriot | Immigrants from Israel |
| Minimum | 2.5% | 4.2% |
| Maximum | 56.1% | 59.3% |
| Range | 53.6% | 55.1% |
| Mean | 23.3% | 27.7% |
| Median | 20.5% | 27.3% |
| Interquartile 25% (IQ1) | 17.0% | 20.0% |
| Interquartile 75% (IQ3) | 26.8% | 34.6% |
| Interquartile Range (IQR) | 9.8% | 14.6% |
| Standard Deviation (Sample) | 10.7% | 12.5% |
| Standard Deviation (Population) | 10.6% | 12.4% |
Demographics Similar to Cypriots and Immigrants from Israel by Master's Degree
In terms of master's degree, the demographic groups most similar to Cypriots are Thai (21.7%, a difference of 0.34%), Immigrants from Iran (21.6%, a difference of 0.75%), Iranian (22.3%, a difference of 2.2%), Immigrants from India (22.3%, a difference of 2.4%), and Immigrants from China (21.2%, a difference of 2.9%). Similarly, the demographic groups most similar to Immigrants from Israel are Okinawan (22.6%, a difference of 0.0%), Immigrants from Taiwan (22.5%, a difference of 0.80%), Immigrants from India (22.3%, a difference of 1.5%), Iranian (22.3%, a difference of 1.7%), and Filipino (23.4%, a difference of 3.4%).
| Demographics | Rating | Rank | Master's Degree |
| Immigrants | Singapore | 100.0 /100 | #1 | Exceptional 23.4% |
| Filipinos | 100.0 /100 | #2 | Exceptional 23.4% |
| Immigrants | Israel | 100.0 /100 | #3 | Exceptional 22.6% |
| Okinawans | 100.0 /100 | #4 | Exceptional 22.6% |
| Immigrants | Taiwan | 100.0 /100 | #5 | Exceptional 22.5% |
| Immigrants | India | 100.0 /100 | #6 | Exceptional 22.3% |
| Iranians | 100.0 /100 | #7 | Exceptional 22.3% |
| Cypriots | 100.0 /100 | #8 | Exceptional 21.8% |
| Thais | 100.0 /100 | #9 | Exceptional 21.7% |
| Immigrants | Iran | 100.0 /100 | #10 | Exceptional 21.6% |
| Immigrants | China | 100.0 /100 | #11 | Exceptional 21.2% |
| Eastern Europeans | 100.0 /100 | #12 | Exceptional 21.1% |
| Immigrants | Australia | 100.0 /100 | #13 | Exceptional 20.9% |
| Immigrants | Switzerland | 100.0 /100 | #14 | Exceptional 20.9% |
| Immigrants | Eastern Asia | 100.0 /100 | #15 | Exceptional 20.8% |
| Immigrants | Belgium | 100.0 /100 | #16 | Exceptional 20.8% |
| Immigrants | South Central Asia | 100.0 /100 | #17 | Exceptional 20.7% |
| Soviet Union | 100.0 /100 | #18 | Exceptional 20.5% |
| Immigrants | Hong Kong | 100.0 /100 | #19 | Exceptional 20.5% |
| Indians (Asian) | 100.0 /100 | #20 | Exceptional 20.5% |