Cypriot vs South American Master's Degree

COMPARE

Cypriot
Race
Ancestry
AfghanAfricanAlaska NativeAlaskan AthabascanAlbanianAleutAlsatianAmericanApacheArabArapahoArgentineanArmenianAssyrian/Chaldean/SyriacAustralianAustrianBahamianBangladeshiBarbadianBasqueBelgianBelizeanBermudanBhutaneseBlackfeetBolivianBrazilianBritishBritish West IndianBulgarianBurmeseCajunCambodianCanadianCape VerdeanCarpatho RusynCelticCentral AmericanCentral American IndianCherokeeCheyenneChickasawChileanChineseChippewaChoctawColombianColvilleComancheCosta RicanCreeCreekCroatianCrowCubanCypriotCzechCzechoslovakianDanishDelawareDominicanDutchDutch West IndianEastern EuropeanEcuadorianEgyptianEnglishEstonianEthiopianEuropeanFijianFilipinoFinnishFrenchFrench American IndianFrench CanadianGermanGerman RussianGhanaianGreekGuamanian/ChamorroGuatemalanGuyaneseHaitianHmongHonduranHopiHoumaHungarianIcelanderIndian (Asian)IndonesianInupiatIranianIraqiIrishIroquoisIsraeliItalianJamaicanJapaneseJordanianKenyanKiowaKoreanLaotianLatvianLebaneseLiberianLithuanianLumbeeLuxembourgerMacedonianMalaysianMalteseMarshalleseMenomineeMexicanMexican American IndianMongolianMoroccanNative HawaiianNavajoNepaleseNew ZealanderNicaraguanNigerianNorthern EuropeanNorwegianOkinawanOsageOttawaPaiutePakistaniPalestinianPanamanianParaguayanPennsylvania GermanPeruvianPimaPolishPortuguesePotawatomiPuebloPuerto RicanPuget Sound SalishRomanianRussianSalvadoranSamoanScandinavianScotch-IrishScottishSeminoleSenegaleseSerbianShoshoneSierra LeoneanSiouxSlavicSlovakSloveneSomaliSouth AfricanSouth American IndianSoviet UnionSpaniardSpanishSpanish AmericanSpanish American IndianSri LankanSubsaharan AfricanSudaneseSwedishSwissSyrianTaiwaneseThaiTlingit-HaidaTohono O'OdhamTonganTrinidadian and TobagonianTsimshianTurkishU.S. Virgin IslanderUgandanUkrainianUruguayanUteVenezuelanVietnameseWelshWest IndianYakamaYaquiYugoslavianYumanYup'ikZimbabwean
Immigration
NonimmigrantsImmigrantsAfghanistanAfricaAlbaniaArgentinaArmeniaAsiaAustraliaAustriaBahamasBangladeshBarbadosBelarusBelgiumBelizeBoliviaBosnia and HerzegovinaBrazilBulgariaBurma/MyanmarCabo VerdeCambodiaCameroonCanadaCaribbeanCentral AmericaChileChinaColombiaCongoCosta RicaCroatiaCubaCzechoslovakiaDenmarkDominicaDominican RepublicEastern AfricaEastern AsiaEastern EuropeEcuadorEgyptEl SalvadorEnglandEritreaEthiopiaEuropeFijiFranceGermanyGhanaGreeceGrenadaGuatemalaGuyanaHaitiHondurasHong KongHungaryIndiaIndonesiaIranIraqIrelandIsraelItalyJamaicaJapanJordanKazakhstanKenyaKoreaKuwaitLaosLatin AmericaLatviaLebanonLiberiaLithuaniaMalaysiaMexicoMicronesiaMiddle AfricaMoldovaMoroccoNepalNetherlandsNicaraguaNigeriaNorth AmericaNorth MacedoniaNorthern AfricaNorthern EuropeNorwayOceaniaPakistanPanamaPeruPhilippinesPolandPortugalRomaniaRussiaSaudi ArabiaScotlandSenegalSerbiaSierra LeoneSingaporeSomaliaSouth AfricaSouth AmericaSouth Central AsiaSouth Eastern AsiaSouthern EuropeSpainSri LankaSt. Vincent and the GrenadinesSudanSwedenSwitzerlandSyriaTaiwanThailandTrinidad and TobagoTurkeyUgandaUkraineUruguayUzbekistanVenezuelaVietnamWest IndiesWestern AfricaWestern AsiaWestern EuropeYemenZaireZimbabweAzores
South American
Race
Ancestry
AfghanAfricanAlaska NativeAlaskan AthabascanAlbanianAleutAlsatianAmericanApacheArabArapahoArgentineanArmenianAssyrian/Chaldean/SyriacAustralianAustrianBahamianBangladeshiBarbadianBasqueBelgianBelizeanBermudanBhutaneseBlackfeetBolivianBrazilianBritishBritish West IndianBulgarianBurmeseCajunCambodianCanadianCape VerdeanCarpatho RusynCelticCentral AmericanCentral American IndianCherokeeCheyenneChickasawChileanChineseChippewaChoctawColombianColvilleComancheCosta RicanCreeCreekCroatianCrowCubanCzechCzechoslovakianDanishDelawareDominicanDutchDutch West IndianEastern EuropeanEcuadorianEgyptianEnglishEstonianEthiopianEuropeanFijianFilipinoFinnishFrenchFrench American IndianFrench CanadianGermanGerman RussianGhanaianGreekGuamanian/ChamorroGuatemalanGuyaneseHaitianHmongHonduranHopiHoumaHungarianIcelanderIndian (Asian)IndonesianInupiatIranianIraqiIrishIroquoisIsraeliItalianJamaicanJapaneseJordanianKenyanKiowaKoreanLaotianLatvianLebaneseLiberianLithuanianLumbeeLuxembourgerMacedonianMalaysianMalteseMarshalleseMenomineeMexicanMexican American IndianMongolianMoroccanNative HawaiianNavajoNepaleseNew ZealanderNicaraguanNigerianNorthern EuropeanNorwegianOkinawanOsageOttawaPaiutePakistaniPalestinianPanamanianParaguayanPennsylvania GermanPeruvianPimaPolishPortuguesePotawatomiPuebloPuerto RicanPuget Sound SalishRomanianRussianSalvadoranSamoanScandinavianScotch-IrishScottishSeminoleSenegaleseSerbianShoshoneSierra LeoneanSiouxSlavicSlovakSloveneSomaliSouth AfricanSouth AmericanSouth American IndianSoviet UnionSpaniardSpanishSpanish AmericanSpanish American IndianSri LankanSubsaharan AfricanSudaneseSwedishSwissSyrianTaiwaneseThaiTlingit-HaidaTohono O'OdhamTonganTrinidadian and TobagonianTsimshianTurkishU.S. Virgin IslanderUgandanUkrainianUruguayanUteVenezuelanVietnameseWelshWest IndianYakamaYaquiYugoslavianYumanYup'ikZimbabwean
Immigration
NonimmigrantsImmigrantsAfghanistanAfricaAlbaniaArgentinaArmeniaAsiaAustraliaAustriaBahamasBangladeshBarbadosBelarusBelgiumBelizeBoliviaBosnia and HerzegovinaBrazilBulgariaBurma/MyanmarCabo VerdeCambodiaCameroonCanadaCaribbeanCentral AmericaChileChinaColombiaCongoCosta RicaCroatiaCubaCzechoslovakiaDenmarkDominicaDominican RepublicEastern AfricaEastern AsiaEastern EuropeEcuadorEgyptEl SalvadorEnglandEritreaEthiopiaEuropeFijiFranceGermanyGhanaGreeceGrenadaGuatemalaGuyanaHaitiHondurasHong KongHungaryIndiaIndonesiaIranIraqIrelandIsraelItalyJamaicaJapanJordanKazakhstanKenyaKoreaKuwaitLaosLatin AmericaLatviaLebanonLiberiaLithuaniaMalaysiaMexicoMicronesiaMiddle AfricaMoldovaMoroccoNepalNetherlandsNicaraguaNigeriaNorth AmericaNorth MacedoniaNorthern AfricaNorthern EuropeNorwayOceaniaPakistanPanamaPeruPhilippinesPolandPortugalRomaniaRussiaSaudi ArabiaScotlandSenegalSerbiaSierra LeoneSingaporeSomaliaSouth AfricaSouth AmericaSouth Central AsiaSouth Eastern AsiaSouthern EuropeSpainSri LankaSt. Vincent and the GrenadinesSudanSwedenSwitzerlandSyriaTaiwanThailandTrinidad and TobagoTurkeyUgandaUkraineUruguayUzbekistanVenezuelaVietnamWest IndiesWestern AfricaWestern AsiaWestern EuropeYemenZaireZimbabweAzores
Master's Degree
Income
Poverty
Unemployment
Labor Participation
Family Structure
Vehicle Availability
Education Level
Disability

Master's Degree Comparison

Cypriots

South Americans

Exceptional
Excellent
21.8%
MASTER'S DEGREE
100.0/ 100
METRIC RATING
8th/ 347
METRIC RANK
15.6%
MASTER'S DEGREE
81.3/ 100
METRIC RATING
145th/ 347
METRIC RANK

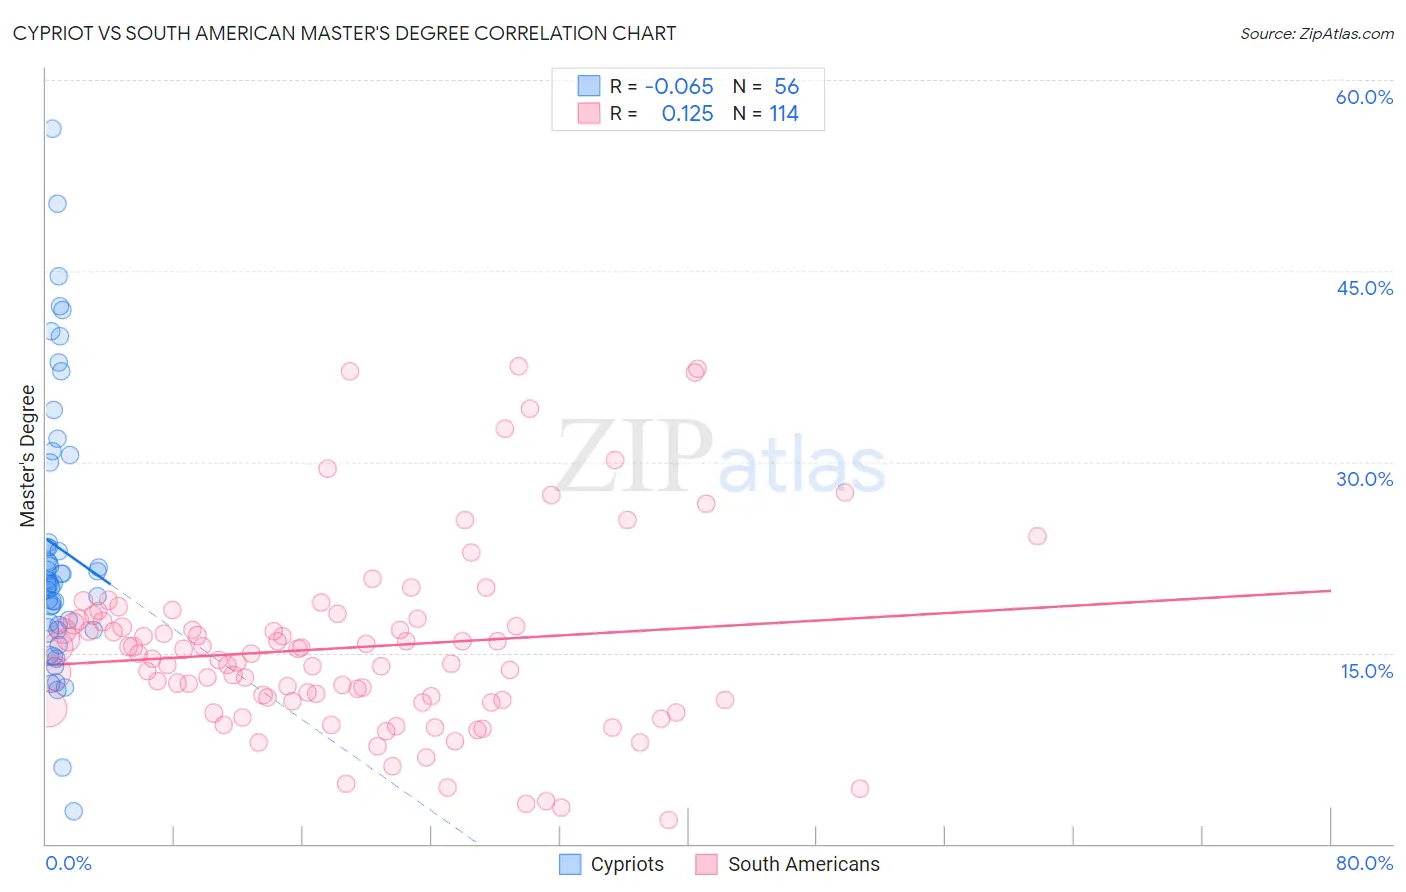
Cypriot vs South American Master's Degree Correlation Chart

The statistical analysis conducted on geographies consisting of 61,862,826 people shows a slight negative correlation between the proportion of Cypriots and percentage of population with at least master's degree education in the United States with a correlation coefficient (R) of -0.065 and weighted average of 21.8%. Similarly, the statistical analysis conducted on geographies consisting of 493,882,123 people shows a poor positive correlation between the proportion of South Americans and percentage of population with at least master's degree education in the United States with a correlation coefficient (R) of 0.125 and weighted average of 15.6%, a difference of 39.5%.
Cypriot vs South American Master's Degree

Master's Degree Correlation Summary

MeasurementCypriotSouth American
Minimum2.5%1.9%
Maximum56.1%37.5%
Range53.6%35.6%
Mean23.3%15.4%
Median20.5%14.7%
Interquartile 25% (IQ1)17.0%11.2%
Interquartile 75% (IQ3)26.8%17.5%
Interquartile Range (IQR)9.8%6.3%
Standard Deviation (Sample)10.7%7.3%
Standard Deviation (Population)10.6%7.3%

Similar Demographics by Master's Degree

Demographics Similar to Cypriots by Master's Degree

In terms of master's degree, the demographic groups most similar to Cypriots are Thai (21.7%, a difference of 0.34%), Immigrants from Iran (21.6%, a difference of 0.75%), Iranian (22.3%, a difference of 2.2%), Immigrants from India (22.3%, a difference of 2.4%), and Immigrants from China (21.2%, a difference of 2.9%).
DemographicsRating | RankMaster's Degree
Immigrants | Singapore
100.0
/100
|
#1
Exceptional
23.4%
Filipinos
100.0
/100
|
#2
Exceptional
23.4%
Immigrants | Israel
100.0
/100
|
#3
Exceptional
22.6%
Okinawans
100.0
/100
|
#4
Exceptional
22.6%
Immigrants | Taiwan
100.0
/100
|
#5
Exceptional
22.5%
Immigrants | India
100.0
/100
|
#6
Exceptional
22.3%
Iranians
100.0
/100
|
#7
Exceptional
22.3%
Cypriots
100.0
/100
|
#8
Exceptional
21.8%
Thais
100.0
/100
|
#9
Exceptional
21.7%
Immigrants | Iran
100.0
/100
|
#10
Exceptional
21.6%
Immigrants | China
100.0
/100
|
#11
Exceptional
21.2%
Eastern Europeans
100.0
/100
|
#12
Exceptional
21.1%
Immigrants | Australia
100.0
/100
|
#13
Exceptional
20.9%
Immigrants | Switzerland
100.0
/100
|
#14
Exceptional
20.9%
Immigrants | Eastern Asia
100.0
/100
|
#15
Exceptional
20.8%

Demographics Similar to South Americans by Master's Degree

In terms of master's degree, the demographic groups most similar to South Americans are Immigrants from Afghanistan (15.6%, a difference of 0.37%), Hungarian (15.6%, a difference of 0.41%), Canadian (15.7%, a difference of 0.42%), Immigrants from Venezuela (15.7%, a difference of 0.50%), and Immigrants from Senegal (15.5%, a difference of 0.58%).
DemographicsRating | RankMaster's Degree
Pakistanis
86.1
/100
|
#138
Excellent
15.8%
Immigrants | Germany
85.9
/100
|
#139
Excellent
15.8%
Vietnamese
85.5
/100
|
#140
Excellent
15.8%
Poles
85.0
/100
|
#141
Excellent
15.7%
Immigrants | Africa
84.0
/100
|
#142
Excellent
15.7%
Immigrants | Venezuela
83.6
/100
|
#143
Excellent
15.7%
Canadians
83.3
/100
|
#144
Excellent
15.7%
South Americans
81.3
/100
|
#145
Excellent
15.6%
Immigrants | Afghanistan
79.4
/100
|
#146
Good
15.6%
Hungarians
79.1
/100
|
#147
Good
15.6%
Immigrants | Senegal
78.2
/100
|
#148
Good
15.5%
Ghanaians
78.2
/100
|
#149
Good
15.5%
Slovenes
78.0
/100
|
#150
Good
15.5%
Iraqis
77.3
/100
|
#151
Good
15.5%
Slavs
77.0
/100
|
#152
Good
15.5%