Cypriot vs Immigrants from Lithuania Master's Degree
COMPARE
Cypriot
Immigrants from Lithuania
Master's Degree
Master's Degree Comparison
Cypriots
Immigrants from Lithuania
21.8%
MASTER'S DEGREE
100.0/ 100
METRIC RATING
8th/ 347
METRIC RANK
18.5%
MASTER'S DEGREE
99.9/ 100
METRIC RATING
54th/ 347
METRIC RANK
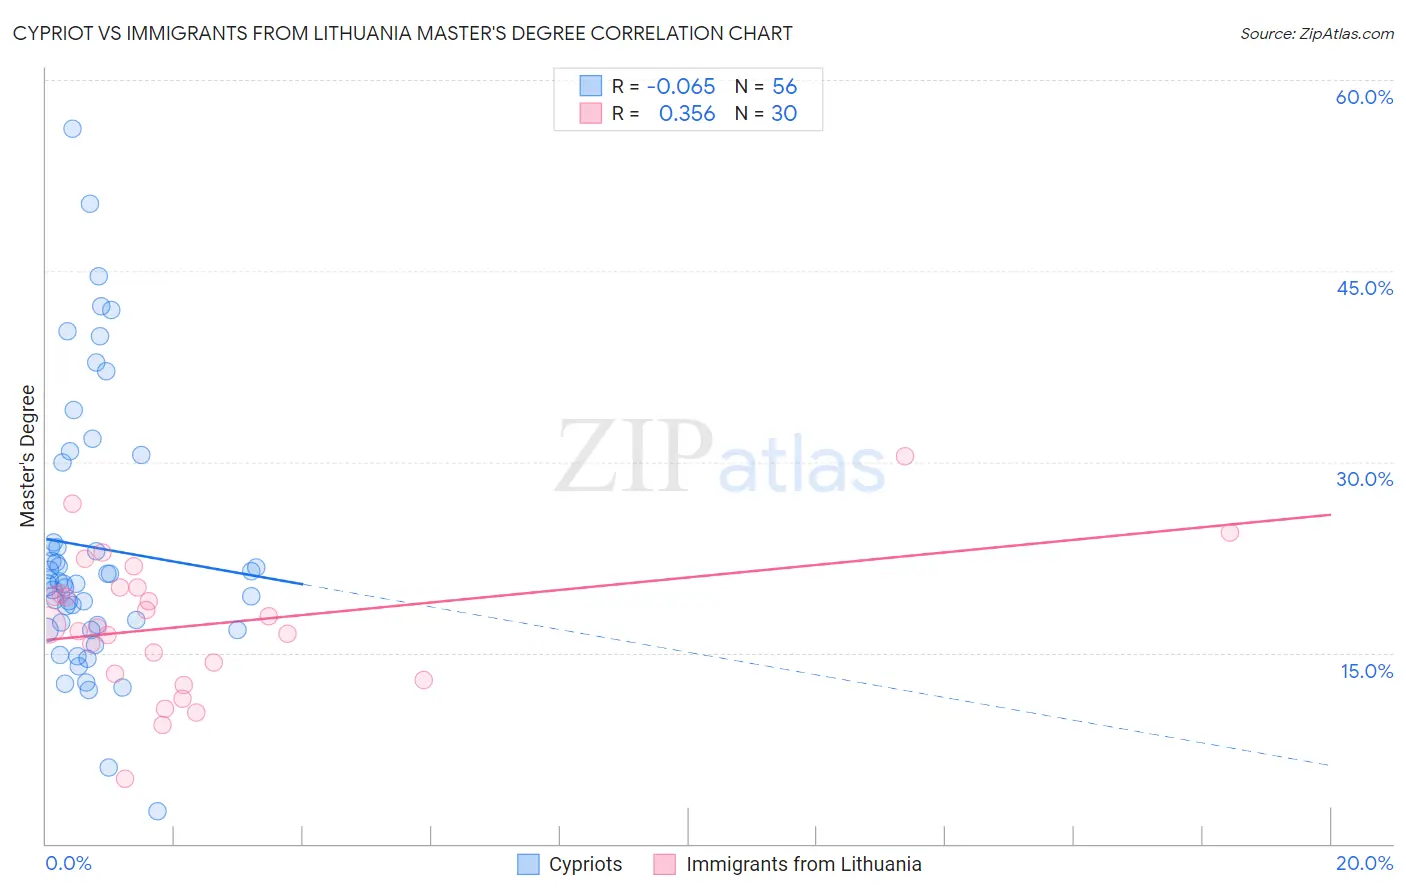
Cypriot vs Immigrants from Lithuania Master's Degree Correlation Chart
The statistical analysis conducted on geographies consisting of 61,862,826 people shows a slight negative correlation between the proportion of Cypriots and percentage of population with at least master's degree education in the United States with a correlation coefficient (R) of -0.065 and weighted average of 21.8%. Similarly, the statistical analysis conducted on geographies consisting of 117,722,731 people shows a mild positive correlation between the proportion of Immigrants from Lithuania and percentage of population with at least master's degree education in the United States with a correlation coefficient (R) of 0.356 and weighted average of 18.5%, a difference of 17.8%.
Master's Degree Correlation Summary
| Measurement | Cypriot | Immigrants from Lithuania |
| Minimum | 2.5% | 5.1% |
| Maximum | 56.1% | 30.4% |
| Range | 53.6% | 25.3% |
| Mean | 23.3% | 17.2% |
| Median | 20.5% | 17.1% |
| Interquartile 25% (IQ1) | 17.0% | 13.3% |
| Interquartile 75% (IQ3) | 26.8% | 20.1% |
| Interquartile Range (IQR) | 9.8% | 6.8% |
| Standard Deviation (Sample) | 10.7% | 5.4% |
| Standard Deviation (Population) | 10.6% | 5.3% |
Similar Demographics by Master's Degree
Demographics Similar to Cypriots by Master's Degree
In terms of master's degree, the demographic groups most similar to Cypriots are Thai (21.7%, a difference of 0.34%), Immigrants from Iran (21.6%, a difference of 0.75%), Iranian (22.3%, a difference of 2.2%), Immigrants from India (22.3%, a difference of 2.4%), and Immigrants from China (21.2%, a difference of 2.9%).
| Demographics | Rating | Rank | Master's Degree |
| Immigrants | Singapore | 100.0 /100 | #1 | Exceptional 23.4% |
| Filipinos | 100.0 /100 | #2 | Exceptional 23.4% |
| Immigrants | Israel | 100.0 /100 | #3 | Exceptional 22.6% |
| Okinawans | 100.0 /100 | #4 | Exceptional 22.6% |
| Immigrants | Taiwan | 100.0 /100 | #5 | Exceptional 22.5% |
| Immigrants | India | 100.0 /100 | #6 | Exceptional 22.3% |
| Iranians | 100.0 /100 | #7 | Exceptional 22.3% |
| Cypriots | 100.0 /100 | #8 | Exceptional 21.8% |
| Thais | 100.0 /100 | #9 | Exceptional 21.7% |
| Immigrants | Iran | 100.0 /100 | #10 | Exceptional 21.6% |
| Immigrants | China | 100.0 /100 | #11 | Exceptional 21.2% |
| Eastern Europeans | 100.0 /100 | #12 | Exceptional 21.1% |
| Immigrants | Australia | 100.0 /100 | #13 | Exceptional 20.9% |
| Immigrants | Switzerland | 100.0 /100 | #14 | Exceptional 20.9% |
| Immigrants | Eastern Asia | 100.0 /100 | #15 | Exceptional 20.8% |
Demographics Similar to Immigrants from Lithuania by Master's Degree
In terms of master's degree, the demographic groups most similar to Immigrants from Lithuania are Immigrants from Serbia (18.5%, a difference of 0.030%), Asian (18.4%, a difference of 0.26%), Immigrants from Czechoslovakia (18.5%, a difference of 0.31%), Immigrants from Kuwait (18.6%, a difference of 0.39%), and Immigrants from Asia (18.4%, a difference of 0.39%).
| Demographics | Rating | Rank | Master's Degree |
| Immigrants | Austria | 100.0 /100 | #47 | Exceptional 18.8% |
| Paraguayans | 100.0 /100 | #48 | Exceptional 18.8% |
| Estonians | 100.0 /100 | #49 | Exceptional 18.8% |
| Bulgarians | 100.0 /100 | #50 | Exceptional 18.8% |
| Immigrants | South Africa | 100.0 /100 | #51 | Exceptional 18.8% |
| Immigrants | Kuwait | 100.0 /100 | #52 | Exceptional 18.6% |
| Immigrants | Czechoslovakia | 99.9 /100 | #53 | Exceptional 18.5% |
| Immigrants | Lithuania | 99.9 /100 | #54 | Exceptional 18.5% |
| Immigrants | Serbia | 99.9 /100 | #55 | Exceptional 18.5% |
| Asians | 99.9 /100 | #56 | Exceptional 18.4% |
| Immigrants | Asia | 99.9 /100 | #57 | Exceptional 18.4% |
| Australians | 99.9 /100 | #58 | Exceptional 18.4% |
| Immigrants | Bulgaria | 99.9 /100 | #59 | Exceptional 18.3% |
| New Zealanders | 99.9 /100 | #60 | Exceptional 18.3% |
| Immigrants | Europe | 99.9 /100 | #61 | Exceptional 18.2% |