Cuban vs Immigrants from Lithuania Doctorate Degree
COMPARE
Cuban
Immigrants from Lithuania
Doctorate Degree
Doctorate Degree Comparison
Cubans
Immigrants from Lithuania
1.4%
DOCTORATE DEGREE
0.1/ 100
METRIC RATING
307th/ 347
METRIC RANK
2.2%
DOCTORATE DEGREE
99.6/ 100
METRIC RATING
83rd/ 347
METRIC RANK
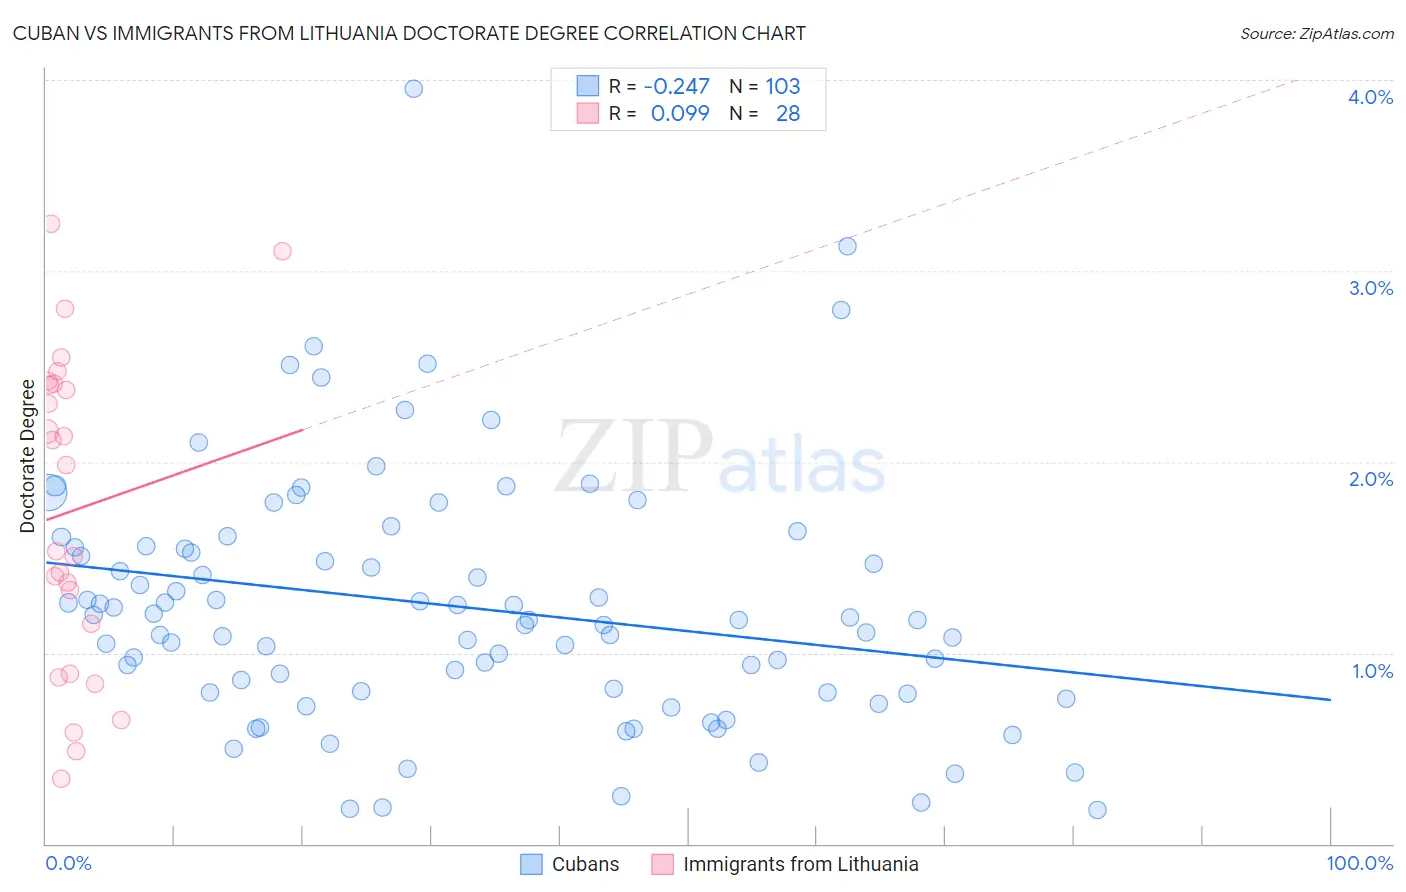
Cuban vs Immigrants from Lithuania Doctorate Degree Correlation Chart
The statistical analysis conducted on geographies consisting of 443,089,370 people shows a weak negative correlation between the proportion of Cubans and percentage of population with at least doctorate degree education in the United States with a correlation coefficient (R) of -0.247 and weighted average of 1.4%. Similarly, the statistical analysis conducted on geographies consisting of 117,578,099 people shows a slight positive correlation between the proportion of Immigrants from Lithuania and percentage of population with at least doctorate degree education in the United States with a correlation coefficient (R) of 0.099 and weighted average of 2.2%, a difference of 60.5%.
Doctorate Degree Correlation Summary
| Measurement | Cuban | Immigrants from Lithuania |
| Minimum | 0.18% | 0.34% |
| Maximum | 4.0% | 3.2% |
| Range | 3.8% | 2.9% |
| Mean | 1.2% | 1.7% |
| Median | 1.2% | 1.8% |
| Interquartile 25% (IQ1) | 0.79% | 1.0% |
| Interquartile 75% (IQ3) | 1.6% | 2.4% |
| Interquartile Range (IQR) | 0.76% | 1.4% |
| Standard Deviation (Sample) | 0.65% | 0.82% |
| Standard Deviation (Population) | 0.65% | 0.81% |
Similar Demographics by Doctorate Degree
Demographics Similar to Cubans by Doctorate Degree
In terms of doctorate degree, the demographic groups most similar to Cubans are Immigrants from Laos (1.4%, a difference of 0.050%), Guyanese (1.4%, a difference of 0.25%), Pennsylvania German (1.4%, a difference of 0.26%), Mexican American Indian (1.4%, a difference of 0.40%), and Immigrants from Dominica (1.4%, a difference of 0.45%).
| Demographics | Rating | Rank | Doctorate Degree |
| Immigrants | Guatemala | 0.1 /100 | #300 | Tragic 1.4% |
| Hondurans | 0.1 /100 | #301 | Tragic 1.4% |
| Shoshone | 0.1 /100 | #302 | Tragic 1.4% |
| Immigrants | Dominica | 0.1 /100 | #303 | Tragic 1.4% |
| Mexican American Indians | 0.1 /100 | #304 | Tragic 1.4% |
| Pennsylvania Germans | 0.1 /100 | #305 | Tragic 1.4% |
| Guyanese | 0.1 /100 | #306 | Tragic 1.4% |
| Cubans | 0.1 /100 | #307 | Tragic 1.4% |
| Immigrants | Laos | 0.1 /100 | #308 | Tragic 1.4% |
| Immigrants | Grenada | 0.1 /100 | #309 | Tragic 1.4% |
| Immigrants | Jamaica | 0.1 /100 | #310 | Tragic 1.4% |
| Immigrants | Honduras | 0.1 /100 | #311 | Tragic 1.4% |
| Immigrants | Nicaragua | 0.1 /100 | #312 | Tragic 1.4% |
| Menominee | 0.1 /100 | #313 | Tragic 1.4% |
| Dominicans | 0.1 /100 | #314 | Tragic 1.4% |
Demographics Similar to Immigrants from Lithuania by Doctorate Degree
In terms of doctorate degree, the demographic groups most similar to Immigrants from Lithuania are Immigrants from England (2.2%, a difference of 0.14%), Immigrants from Uganda (2.2%, a difference of 0.17%), Immigrants from Brazil (2.2%, a difference of 0.27%), Immigrants from Argentina (2.2%, a difference of 0.71%), and Ugandan (2.2%, a difference of 0.77%).
| Demographics | Rating | Rank | Doctorate Degree |
| Immigrants | Hungary | 99.8 /100 | #76 | Exceptional 2.2% |
| Immigrants | Lebanon | 99.8 /100 | #77 | Exceptional 2.2% |
| Immigrants | Belarus | 99.7 /100 | #78 | Exceptional 2.2% |
| Northern Europeans | 99.7 /100 | #79 | Exceptional 2.2% |
| Ugandans | 99.7 /100 | #80 | Exceptional 2.2% |
| Immigrants | Argentina | 99.7 /100 | #81 | Exceptional 2.2% |
| Immigrants | Uganda | 99.6 /100 | #82 | Exceptional 2.2% |
| Immigrants | Lithuania | 99.6 /100 | #83 | Exceptional 2.2% |
| Immigrants | England | 99.6 /100 | #84 | Exceptional 2.2% |
| Immigrants | Brazil | 99.6 /100 | #85 | Exceptional 2.2% |
| Egyptians | 99.4 /100 | #86 | Exceptional 2.2% |
| Immigrants | Zimbabwe | 99.4 /100 | #87 | Exceptional 2.2% |
| Immigrants | Nepal | 99.3 /100 | #88 | Exceptional 2.2% |
| British | 99.3 /100 | #89 | Exceptional 2.2% |
| Immigrants | Scotland | 99.2 /100 | #90 | Exceptional 2.2% |