Cuban vs Immigrants from Western Asia GED/Equivalency
COMPARE
Cuban
Immigrants from Western Asia
GED/Equivalency
GED/Equivalency Comparison
Cubans
Immigrants from Western Asia
82.0%
GED/EQUIVALENCY
0.0/ 100
METRIC RATING
291st/ 347
METRIC RANK
86.3%
GED/EQUIVALENCY
78.8/ 100
METRIC RATING
150th/ 347
METRIC RANK
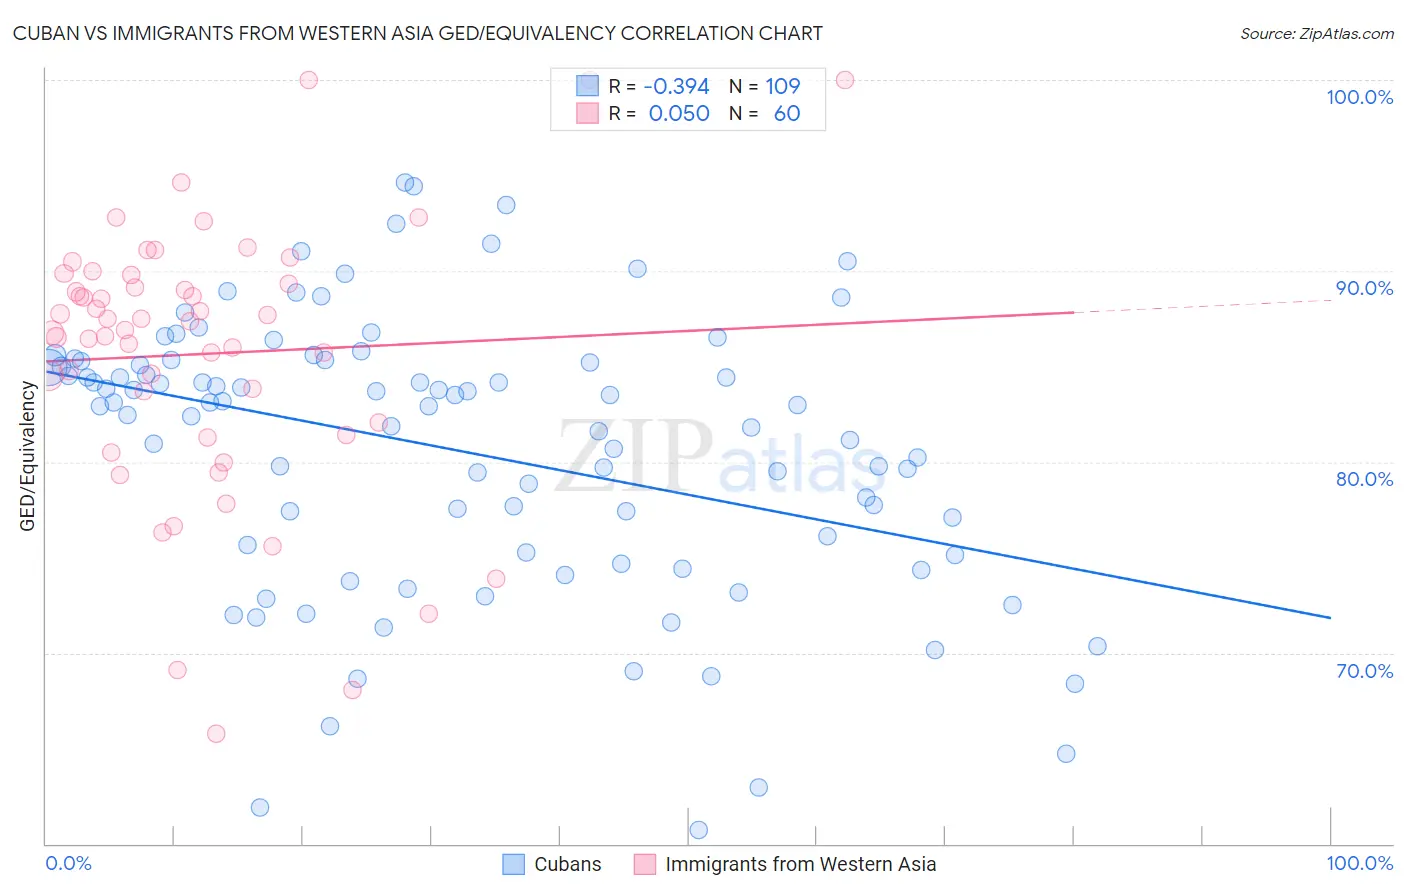
Cuban vs Immigrants from Western Asia GED/Equivalency Correlation Chart
The statistical analysis conducted on geographies consisting of 449,373,028 people shows a mild negative correlation between the proportion of Cubans and percentage of population with at least ged/equivalency education in the United States with a correlation coefficient (R) of -0.394 and weighted average of 82.0%. Similarly, the statistical analysis conducted on geographies consisting of 404,408,465 people shows no correlation between the proportion of Immigrants from Western Asia and percentage of population with at least ged/equivalency education in the United States with a correlation coefficient (R) of 0.050 and weighted average of 86.3%, a difference of 5.2%.
GED/Equivalency Correlation Summary
| Measurement | Cuban | Immigrants from Western Asia |
| Minimum | 60.7% | 65.8% |
| Maximum | 94.6% | 100.0% |
| Range | 33.9% | 34.2% |
| Mean | 80.6% | 85.7% |
| Median | 82.9% | 87.1% |
| Interquartile 25% (IQ1) | 75.2% | 81.7% |
| Interquartile 75% (IQ3) | 85.2% | 89.6% |
| Interquartile Range (IQR) | 10.1% | 7.8% |
| Standard Deviation (Sample) | 7.2% | 7.1% |
| Standard Deviation (Population) | 7.2% | 7.1% |
Similar Demographics by GED/Equivalency
Demographics Similar to Cubans by GED/Equivalency
In terms of ged/equivalency, the demographic groups most similar to Cubans are Haitian (82.1%, a difference of 0.020%), Paiute (82.0%, a difference of 0.040%), British West Indian (82.0%, a difference of 0.040%), Immigrants from St. Vincent and the Grenadines (82.0%, a difference of 0.070%), and Nepalese (81.9%, a difference of 0.13%).
| Demographics | Rating | Rank | GED/Equivalency |
| Immigrants | Barbados | 0.1 /100 | #284 | Tragic 82.4% |
| Cajuns | 0.0 /100 | #285 | Tragic 82.4% |
| Immigrants | West Indies | 0.0 /100 | #286 | Tragic 82.4% |
| Japanese | 0.0 /100 | #287 | Tragic 82.4% |
| Pueblo | 0.0 /100 | #288 | Tragic 82.3% |
| Immigrants | Cambodia | 0.0 /100 | #289 | Tragic 82.2% |
| Haitians | 0.0 /100 | #290 | Tragic 82.1% |
| Cubans | 0.0 /100 | #291 | Tragic 82.0% |
| Paiute | 0.0 /100 | #292 | Tragic 82.0% |
| British West Indians | 0.0 /100 | #293 | Tragic 82.0% |
| Immigrants | St. Vincent and the Grenadines | 0.0 /100 | #294 | Tragic 82.0% |
| Nepalese | 0.0 /100 | #295 | Tragic 81.9% |
| Vietnamese | 0.0 /100 | #296 | Tragic 81.9% |
| Immigrants | Bangladesh | 0.0 /100 | #297 | Tragic 81.9% |
| Ute | 0.0 /100 | #298 | Tragic 81.8% |
Demographics Similar to Immigrants from Western Asia by GED/Equivalency
In terms of ged/equivalency, the demographic groups most similar to Immigrants from Western Asia are Menominee (86.3%, a difference of 0.010%), Basque (86.4%, a difference of 0.020%), Immigrants from Northern Africa (86.3%, a difference of 0.020%), Immigrants from Poland (86.3%, a difference of 0.020%), and Immigrants from Bosnia and Herzegovina (86.3%, a difference of 0.030%).
| Demographics | Rating | Rank | GED/Equivalency |
| Immigrants | Pakistan | 82.4 /100 | #143 | Excellent 86.4% |
| Bolivians | 82.1 /100 | #144 | Excellent 86.4% |
| Pakistanis | 80.4 /100 | #145 | Excellent 86.4% |
| Basques | 79.5 /100 | #146 | Good 86.4% |
| Immigrants | Northern Africa | 79.3 /100 | #147 | Good 86.3% |
| Immigrants | Poland | 79.3 /100 | #148 | Good 86.3% |
| Menominee | 79.3 /100 | #149 | Good 86.3% |
| Immigrants | Western Asia | 78.8 /100 | #150 | Good 86.3% |
| Immigrants | Bosnia and Herzegovina | 77.9 /100 | #151 | Good 86.3% |
| Brazilians | 77.2 /100 | #152 | Good 86.3% |
| Kenyans | 76.6 /100 | #153 | Good 86.3% |
| Armenians | 76.4 /100 | #154 | Good 86.3% |
| Iraqis | 75.2 /100 | #155 | Good 86.2% |
| Immigrants | Nepal | 73.3 /100 | #156 | Good 86.2% |
| Whites/Caucasians | 72.2 /100 | #157 | Good 86.2% |