Cuban vs Colombian 3rd Grade
COMPARE
Cuban
Colombian
3rd Grade
3rd Grade Comparison
Cubans
Colombians
97.3%
3RD GRADE
0.2/ 100
METRIC RATING
268th/ 347
METRIC RANK
97.4%
3RD GRADE
1.8/ 100
METRIC RATING
237th/ 347
METRIC RANK
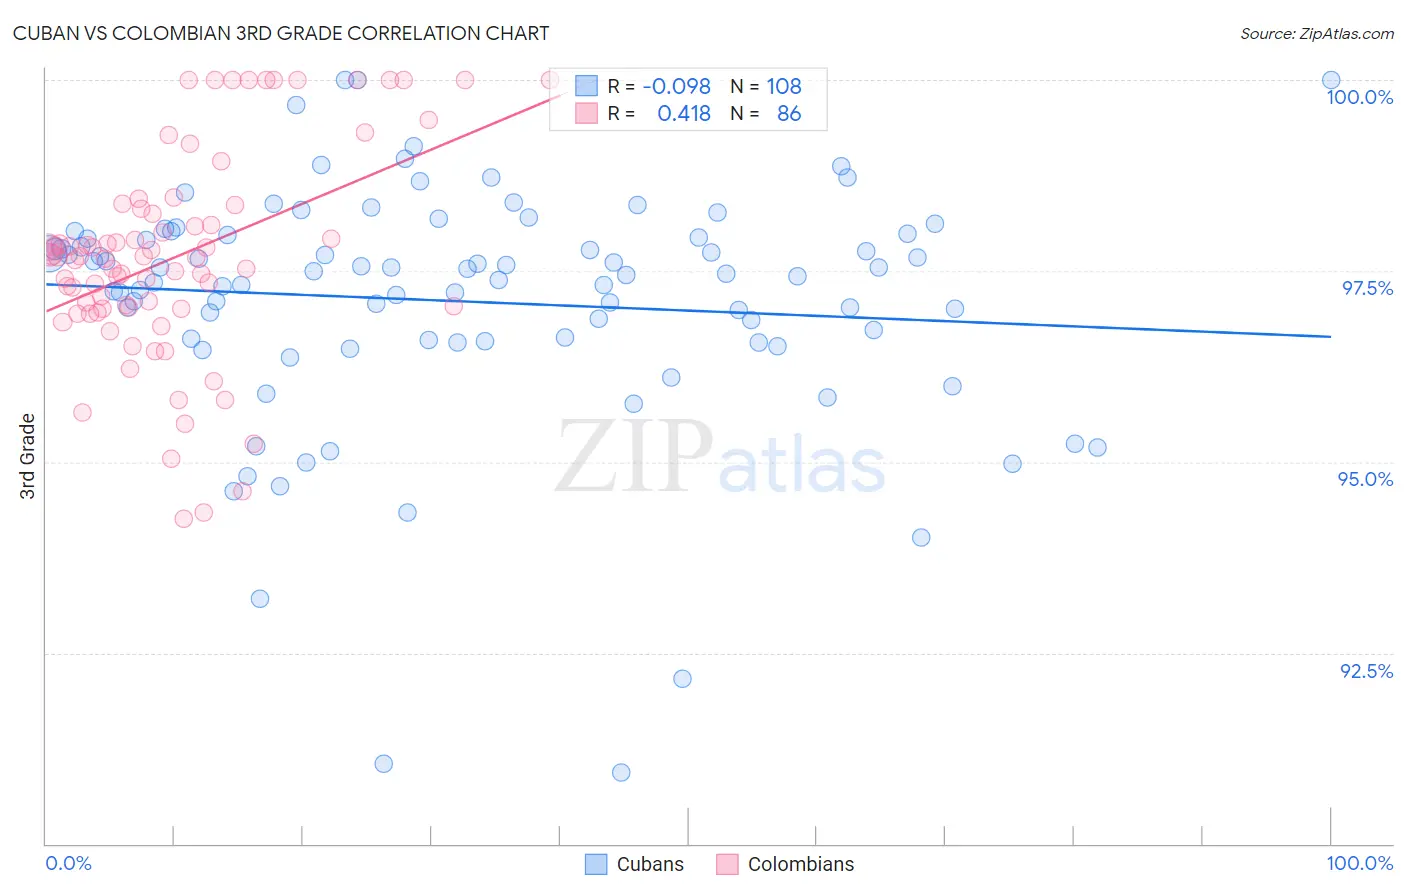
Cuban vs Colombian 3rd Grade Correlation Chart
The statistical analysis conducted on geographies consisting of 449,326,865 people shows a slight negative correlation between the proportion of Cubans and percentage of population with at least 3rd grade education in the United States with a correlation coefficient (R) of -0.098 and weighted average of 97.3%. Similarly, the statistical analysis conducted on geographies consisting of 419,700,680 people shows a moderate positive correlation between the proportion of Colombians and percentage of population with at least 3rd grade education in the United States with a correlation coefficient (R) of 0.418 and weighted average of 97.4%, a difference of 0.17%.
3rd Grade Correlation Summary
| Measurement | Cuban | Colombian |
| Minimum | 90.9% | 94.3% |
| Maximum | 100.0% | 100.0% |
| Range | 9.1% | 5.7% |
| Mean | 97.1% | 97.7% |
| Median | 97.5% | 97.7% |
| Interquartile 25% (IQ1) | 96.6% | 97.0% |
| Interquartile 75% (IQ3) | 98.0% | 98.3% |
| Interquartile Range (IQR) | 1.4% | 1.3% |
| Standard Deviation (Sample) | 1.6% | 1.4% |
| Standard Deviation (Population) | 1.6% | 1.4% |
Similar Demographics by 3rd Grade
Demographics Similar to Cubans by 3rd Grade
In terms of 3rd grade, the demographic groups most similar to Cubans are Fijian (97.3%, a difference of 0.0%), Yaqui (97.3%, a difference of 0.010%), Immigrants from Nigeria (97.3%, a difference of 0.010%), Immigrants from Jamaica (97.3%, a difference of 0.020%), and Taiwanese (97.3%, a difference of 0.030%).
| Demographics | Rating | Rank | 3rd Grade |
| Immigrants | South America | 0.4 /100 | #261 | Tragic 97.3% |
| Immigrants | Sierra Leone | 0.4 /100 | #262 | Tragic 97.3% |
| Taiwanese | 0.3 /100 | #263 | Tragic 97.3% |
| West Indians | 0.3 /100 | #264 | Tragic 97.3% |
| Immigrants | Jamaica | 0.3 /100 | #265 | Tragic 97.3% |
| Yaqui | 0.3 /100 | #266 | Tragic 97.3% |
| Immigrants | Nigeria | 0.3 /100 | #267 | Tragic 97.3% |
| Cubans | 0.2 /100 | #268 | Tragic 97.3% |
| Fijians | 0.2 /100 | #269 | Tragic 97.3% |
| Immigrants | China | 0.2 /100 | #270 | Tragic 97.2% |
| Puerto Ricans | 0.2 /100 | #271 | Tragic 97.2% |
| Ghanaians | 0.1 /100 | #272 | Tragic 97.2% |
| Immigrants | Peru | 0.1 /100 | #273 | Tragic 97.2% |
| Immigrants | Cameroon | 0.1 /100 | #274 | Tragic 97.2% |
| Immigrants | Uzbekistan | 0.1 /100 | #275 | Tragic 97.2% |
Demographics Similar to Colombians by 3rd Grade
In terms of 3rd grade, the demographic groups most similar to Colombians are Immigrants from Iraq (97.4%, a difference of 0.0%), Liberian (97.4%, a difference of 0.0%), Immigrants from Uruguay (97.4%, a difference of 0.0%), Immigrants from Eastern Asia (97.4%, a difference of 0.010%), and Nigerian (97.4%, a difference of 0.010%).
| Demographics | Rating | Rank | 3rd Grade |
| Immigrants | Pakistan | 2.7 /100 | #230 | Tragic 97.5% |
| Immigrants | Costa Rica | 2.7 /100 | #231 | Tragic 97.5% |
| Immigrants | Western Asia | 2.6 /100 | #232 | Tragic 97.5% |
| Immigrants | Malaysia | 2.4 /100 | #233 | Tragic 97.5% |
| Immigrants | Eastern Asia | 1.9 /100 | #234 | Tragic 97.4% |
| Immigrants | Iraq | 1.8 /100 | #235 | Tragic 97.4% |
| Liberians | 1.8 /100 | #236 | Tragic 97.4% |
| Colombians | 1.8 /100 | #237 | Tragic 97.4% |
| Immigrants | Uruguay | 1.7 /100 | #238 | Tragic 97.4% |
| Nigerians | 1.6 /100 | #239 | Tragic 97.4% |
| U.S. Virgin Islanders | 1.4 /100 | #240 | Tragic 97.4% |
| Immigrants | Indonesia | 1.4 /100 | #241 | Tragic 97.4% |
| Koreans | 1.3 /100 | #242 | Tragic 97.4% |
| Indians (Asian) | 1.3 /100 | #243 | Tragic 97.4% |
| Asians | 1.1 /100 | #244 | Tragic 97.4% |