Cuban vs Colombian Births to Unmarried Women
COMPARE
Cuban
Colombian
Births to Unmarried Women
Births to Unmarried Women Comparison
Cubans
Colombians
39.4%
BIRTHS TO UNMARRIED WOMEN
0.0/ 100
METRIC RATING
309th/ 347
METRIC RANK
32.2%
BIRTHS TO UNMARRIED WOMEN
31.9/ 100
METRIC RATING
192nd/ 347
METRIC RANK
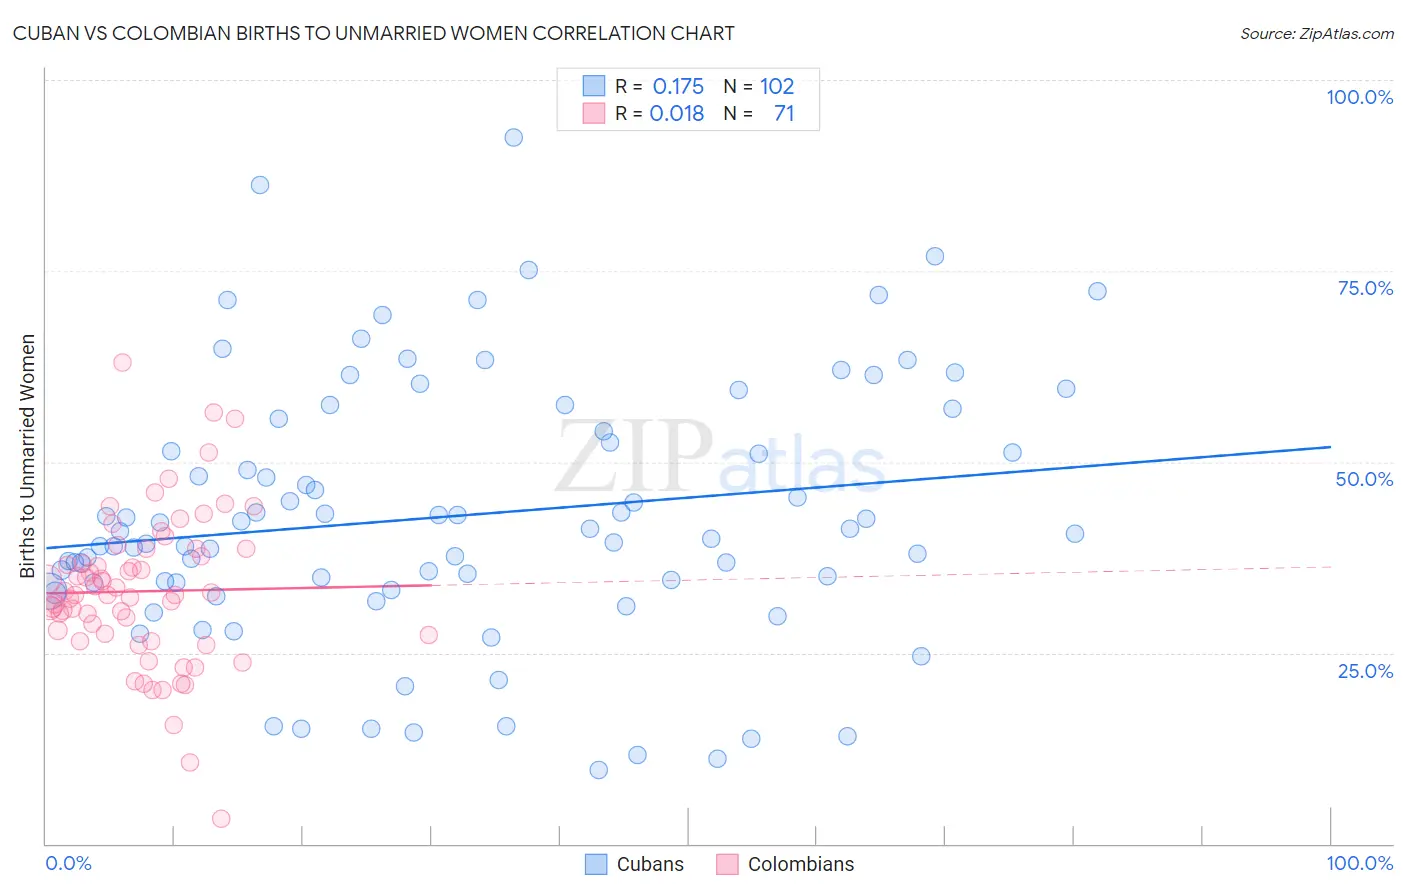
Cuban vs Colombian Births to Unmarried Women Correlation Chart
The statistical analysis conducted on geographies consisting of 417,413,482 people shows a poor positive correlation between the proportion of Cubans and percentage of births to unmarried women in the United States with a correlation coefficient (R) of 0.175 and weighted average of 39.4%. Similarly, the statistical analysis conducted on geographies consisting of 391,716,321 people shows no correlation between the proportion of Colombians and percentage of births to unmarried women in the United States with a correlation coefficient (R) of 0.018 and weighted average of 32.2%, a difference of 22.2%.
Births to Unmarried Women Correlation Summary
| Measurement | Cuban | Colombian |
| Minimum | 9.6% | 3.3% |
| Maximum | 92.5% | 63.0% |
| Range | 82.9% | 59.7% |
| Mean | 42.9% | 33.1% |
| Median | 40.7% | 32.6% |
| Interquartile 25% (IQ1) | 34.2% | 27.3% |
| Interquartile 75% (IQ3) | 54.0% | 38.6% |
| Interquartile Range (IQR) | 19.8% | 11.3% |
| Standard Deviation (Sample) | 17.0% | 10.0% |
| Standard Deviation (Population) | 16.9% | 9.9% |
Similar Demographics by Births to Unmarried Women
Demographics Similar to Cubans by Births to Unmarried Women
In terms of births to unmarried women, the demographic groups most similar to Cubans are Aleut (39.3%, a difference of 0.12%), Immigrants from Honduras (39.3%, a difference of 0.21%), Immigrants from Dominica (39.5%, a difference of 0.22%), Immigrants from the Azores (39.6%, a difference of 0.46%), and U.S. Virgin Islander (39.6%, a difference of 0.48%).
| Demographics | Rating | Rank | Births to Unmarried Women |
| Hondurans | 0.0 /100 | #302 | Tragic 38.7% |
| Immigrants | Jamaica | 0.0 /100 | #303 | Tragic 38.8% |
| Yaqui | 0.0 /100 | #304 | Tragic 38.8% |
| Immigrants | Haiti | 0.0 /100 | #305 | Tragic 38.9% |
| Central American Indians | 0.0 /100 | #306 | Tragic 39.0% |
| Immigrants | Honduras | 0.0 /100 | #307 | Tragic 39.3% |
| Aleuts | 0.0 /100 | #308 | Tragic 39.3% |
| Cubans | 0.0 /100 | #309 | Tragic 39.4% |
| Immigrants | Dominica | 0.0 /100 | #310 | Tragic 39.5% |
| Immigrants | Azores | 0.0 /100 | #311 | Tragic 39.6% |
| U.S. Virgin Islanders | 0.0 /100 | #312 | Tragic 39.6% |
| Africans | 0.0 /100 | #313 | Tragic 39.7% |
| Immigrants | Caribbean | 0.0 /100 | #314 | Tragic 39.8% |
| Dominicans | 0.0 /100 | #315 | Tragic 39.8% |
| Apache | 0.0 /100 | #316 | Tragic 39.9% |
Demographics Similar to Colombians by Births to Unmarried Women
In terms of births to unmarried women, the demographic groups most similar to Colombians are Irish (32.2%, a difference of 0.050%), Tlingit-Haida (32.2%, a difference of 0.080%), Fijian (32.3%, a difference of 0.090%), Sudanese (32.4%, a difference of 0.51%), and Immigrants from Kenya (32.1%, a difference of 0.52%).
| Demographics | Rating | Rank | Births to Unmarried Women |
| Germans | 39.5 /100 | #185 | Fair 32.0% |
| Welsh | 38.2 /100 | #186 | Fair 32.0% |
| Czechoslovakians | 38.0 /100 | #187 | Fair 32.0% |
| Osage | 37.1 /100 | #188 | Fair 32.1% |
| Immigrants | Kenya | 36.9 /100 | #189 | Fair 32.1% |
| Tlingit-Haida | 32.6 /100 | #190 | Fair 32.2% |
| Irish | 32.4 /100 | #191 | Fair 32.2% |
| Colombians | 31.9 /100 | #192 | Fair 32.2% |
| Fijians | 31.1 /100 | #193 | Fair 32.3% |
| Sudanese | 27.3 /100 | #194 | Fair 32.4% |
| Samoans | 21.9 /100 | #195 | Fair 32.6% |
| Immigrants | Colombia | 21.7 /100 | #196 | Fair 32.6% |
| Immigrants | Immigrants | 20.6 /100 | #197 | Fair 32.7% |
| Costa Ricans | 20.3 /100 | #198 | Fair 32.7% |
| Immigrants | Thailand | 18.9 /100 | #199 | Poor 32.8% |