Cuban vs Immigrants from China No Schooling Completed
COMPARE
Cuban
Immigrants from China
No Schooling Completed
No Schooling Completed Comparison
Cubans
Immigrants from China
2.5%
NO SCHOOLING COMPLETED
0.2/ 100
METRIC RATING
271st/ 347
METRIC RANK
2.6%
NO SCHOOLING COMPLETED
0.1/ 100
METRIC RATING
275th/ 347
METRIC RANK
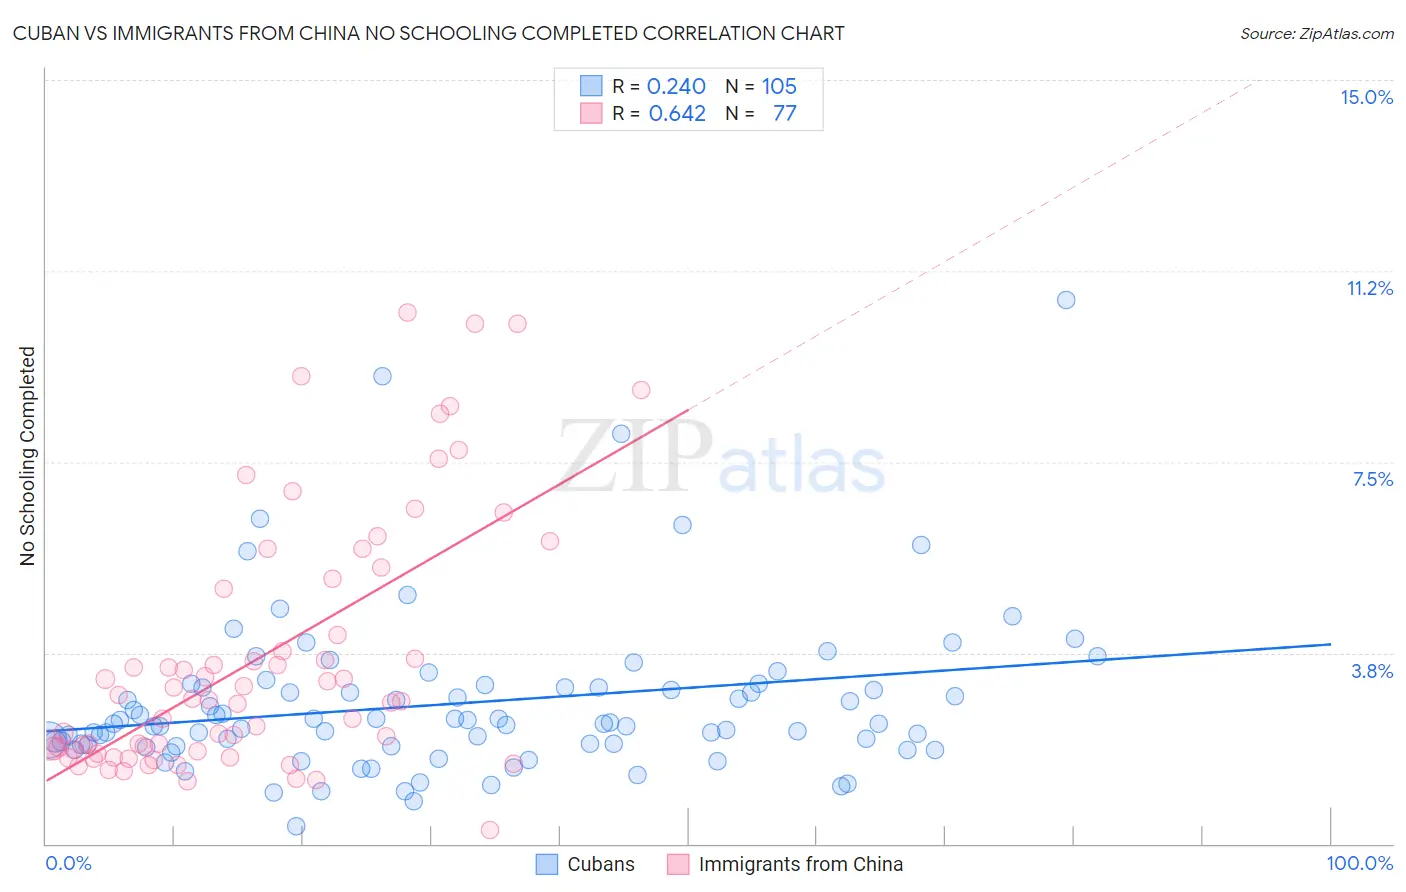
Cuban vs Immigrants from China No Schooling Completed Correlation Chart
The statistical analysis conducted on geographies consisting of 444,053,579 people shows a weak positive correlation between the proportion of Cubans and percentage of population with no schooling in the United States with a correlation coefficient (R) of 0.240 and weighted average of 2.5%. Similarly, the statistical analysis conducted on geographies consisting of 450,744,905 people shows a significant positive correlation between the proportion of Immigrants from China and percentage of population with no schooling in the United States with a correlation coefficient (R) of 0.642 and weighted average of 2.6%, a difference of 1.9%.
No Schooling Completed Correlation Summary
| Measurement | Cuban | Immigrants from China |
| Minimum | 0.33% | 0.26% |
| Maximum | 10.7% | 10.4% |
| Range | 10.4% | 10.2% |
| Mean | 2.8% | 3.6% |
| Median | 2.4% | 2.8% |
| Interquartile 25% (IQ1) | 1.9% | 1.8% |
| Interquartile 75% (IQ3) | 3.1% | 5.1% |
| Interquartile Range (IQR) | 1.1% | 3.3% |
| Standard Deviation (Sample) | 1.6% | 2.5% |
| Standard Deviation (Population) | 1.6% | 2.5% |
Demographics Similar to Cubans and Immigrants from China by No Schooling Completed
In terms of no schooling completed, the demographic groups most similar to Cubans are Immigrants from Peru (2.5%, a difference of 0.010%), Immigrants from Nigeria (2.5%, a difference of 0.090%), Immigrants from Bolivia (2.5%, a difference of 0.53%), Taiwanese (2.5%, a difference of 0.95%), and Yuman (2.5%, a difference of 1.2%). Similarly, the demographic groups most similar to Immigrants from China are Ghanaian (2.6%, a difference of 0.18%), Immigrants from Cameroon (2.5%, a difference of 0.56%), Immigrants from Western Africa (2.6%, a difference of 0.56%), Immigrants from Philippines (2.6%, a difference of 0.61%), and Immigrants from Uzbekistan (2.6%, a difference of 0.81%).
| Demographics | Rating | Rank | No Schooling Completed |
| Immigrants | Liberia | 0.4 /100 | #263 | Tragic 2.5% |
| Indians (Asian) | 0.4 /100 | #264 | Tragic 2.5% |
| West Indians | 0.4 /100 | #265 | Tragic 2.5% |
| Fijians | 0.4 /100 | #266 | Tragic 2.5% |
| Yuman | 0.4 /100 | #267 | Tragic 2.5% |
| Taiwanese | 0.3 /100 | #268 | Tragic 2.5% |
| Immigrants | Nigeria | 0.2 /100 | #269 | Tragic 2.5% |
| Immigrants | Peru | 0.2 /100 | #270 | Tragic 2.5% |
| Cubans | 0.2 /100 | #271 | Tragic 2.5% |
| Immigrants | Bolivia | 0.2 /100 | #272 | Tragic 2.5% |
| Immigrants | Cameroon | 0.1 /100 | #273 | Tragic 2.5% |
| Ghanaians | 0.1 /100 | #274 | Tragic 2.6% |
| Immigrants | China | 0.1 /100 | #275 | Tragic 2.6% |
| Immigrants | Western Africa | 0.1 /100 | #276 | Tragic 2.6% |
| Immigrants | Philippines | 0.1 /100 | #277 | Tragic 2.6% |
| Immigrants | Uzbekistan | 0.1 /100 | #278 | Tragic 2.6% |
| Barbadians | 0.1 /100 | #279 | Tragic 2.6% |
| Trinidadians and Tobagonians | 0.1 /100 | #280 | Tragic 2.6% |
| Afghans | 0.1 /100 | #281 | Tragic 2.6% |
| Immigrants | Ghana | 0.1 /100 | #282 | Tragic 2.6% |
| Immigrants | Trinidad and Tobago | 0.0 /100 | #283 | Tragic 2.6% |