Cuban vs American Disability Age Over 75
COMPARE
Cuban
American
Disability Age Over 75
Disability Age Over 75 Comparison
Cubans
Americans
47.4%
DISABILITY AGE OVER 75
42.1/ 100
METRIC RATING
178th/ 347
METRIC RANK
48.4%
DISABILITY AGE OVER 75
1.7/ 100
METRIC RATING
245th/ 347
METRIC RANK
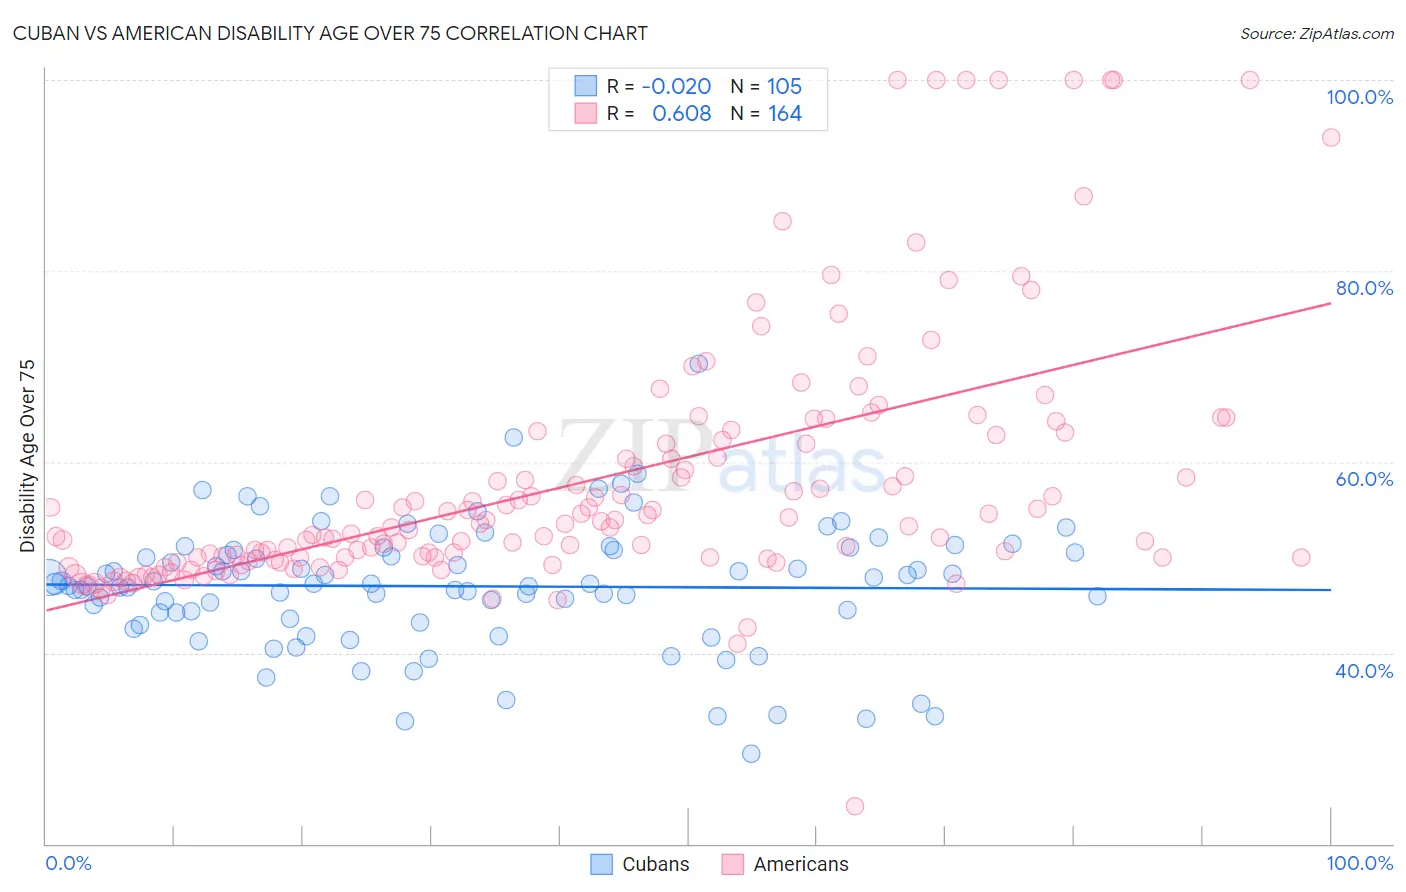
Cuban vs American Disability Age Over 75 Correlation Chart
The statistical analysis conducted on geographies consisting of 448,287,267 people shows no correlation between the proportion of Cubans and percentage of population with a disability over the age of 75 in the United States with a correlation coefficient (R) of -0.020 and weighted average of 47.4%. Similarly, the statistical analysis conducted on geographies consisting of 579,462,277 people shows a significant positive correlation between the proportion of Americans and percentage of population with a disability over the age of 75 in the United States with a correlation coefficient (R) of 0.608 and weighted average of 48.4%, a difference of 2.1%.
Disability Age Over 75 Correlation Summary
| Measurement | Cuban | American |
| Minimum | 29.4% | 23.9% |
| Maximum | 70.3% | 100.0% |
| Range | 40.8% | 76.1% |
| Mean | 47.0% | 58.0% |
| Median | 47.2% | 53.4% |
| Interquartile 25% (IQ1) | 43.9% | 50.0% |
| Interquartile 75% (IQ3) | 50.7% | 62.0% |
| Interquartile Range (IQR) | 6.9% | 12.1% |
| Standard Deviation (Sample) | 6.6% | 13.5% |
| Standard Deviation (Population) | 6.6% | 13.4% |
Similar Demographics by Disability Age Over 75
Demographics Similar to Cubans by Disability Age Over 75
In terms of disability age over 75, the demographic groups most similar to Cubans are Sierra Leonean (47.4%, a difference of 0.010%), Immigrants from Ecuador (47.4%, a difference of 0.010%), Immigrants from Kazakhstan (47.4%, a difference of 0.040%), Immigrants from Moldova (47.4%, a difference of 0.050%), and Haitian (47.4%, a difference of 0.060%).
| Demographics | Rating | Rank | Disability Age Over 75 |
| Immigrants | Africa | 53.6 /100 | #171 | Average 47.3% |
| Scotch-Irish | 52.5 /100 | #172 | Average 47.3% |
| Alsatians | 51.9 /100 | #173 | Average 47.3% |
| Whites/Caucasians | 50.0 /100 | #174 | Average 47.3% |
| Immigrants | Haiti | 49.7 /100 | #175 | Average 47.3% |
| Ecuadorians | 46.7 /100 | #176 | Average 47.4% |
| Haitians | 44.6 /100 | #177 | Average 47.4% |
| Cubans | 42.1 /100 | #178 | Average 47.4% |
| Sierra Leoneans | 41.7 /100 | #179 | Average 47.4% |
| Immigrants | Ecuador | 41.7 /100 | #180 | Average 47.4% |
| Immigrants | Kazakhstan | 40.4 /100 | #181 | Average 47.4% |
| Immigrants | Moldova | 39.9 /100 | #182 | Fair 47.4% |
| Delaware | 39.1 /100 | #183 | Fair 47.5% |
| Immigrants | Nigeria | 34.0 /100 | #184 | Fair 47.5% |
| Ghanaians | 33.0 /100 | #185 | Fair 47.5% |
Demographics Similar to Americans by Disability Age Over 75
In terms of disability age over 75, the demographic groups most similar to Americans are Afghan (48.4%, a difference of 0.020%), Chippewa (48.4%, a difference of 0.030%), Iroquois (48.4%, a difference of 0.050%), Immigrants from Caribbean (48.4%, a difference of 0.11%), and Sri Lankan (48.5%, a difference of 0.11%).
| Demographics | Rating | Rank | Disability Age Over 75 |
| Nicaraguans | 3.0 /100 | #238 | Tragic 48.3% |
| Immigrants | Thailand | 2.8 /100 | #239 | Tragic 48.3% |
| Tongans | 2.3 /100 | #240 | Tragic 48.3% |
| Native Hawaiians | 2.2 /100 | #241 | Tragic 48.3% |
| French American Indians | 2.2 /100 | #242 | Tragic 48.3% |
| Immigrants | Caribbean | 2.1 /100 | #243 | Tragic 48.4% |
| Afghans | 1.8 /100 | #244 | Tragic 48.4% |
| Americans | 1.7 /100 | #245 | Tragic 48.4% |
| Chippewa | 1.6 /100 | #246 | Tragic 48.4% |
| Iroquois | 1.6 /100 | #247 | Tragic 48.4% |
| Sri Lankans | 1.4 /100 | #248 | Tragic 48.5% |
| Iraqis | 1.0 /100 | #249 | Tragic 48.6% |
| West Indians | 0.8 /100 | #250 | Tragic 48.6% |
| Koreans | 0.8 /100 | #251 | Tragic 48.6% |
| Immigrants | South Eastern Asia | 0.7 /100 | #252 | Tragic 48.7% |