Cuban vs American Unemployment Among Ages 35 to 44 years
COMPARE
Cuban
American
Unemployment Among Ages 35 to 44 years
Unemployment Among Ages 35 to 44 years Comparison
Cubans
Americans
4.2%
UNEMPLOYMENT AMONG AGES 35 TO 44 YEARS
99.8/ 100
METRIC RATING
16th/ 347
METRIC RANK
4.9%
UNEMPLOYMENT AMONG AGES 35 TO 44 YEARS
6.2/ 100
METRIC RATING
216th/ 347
METRIC RANK
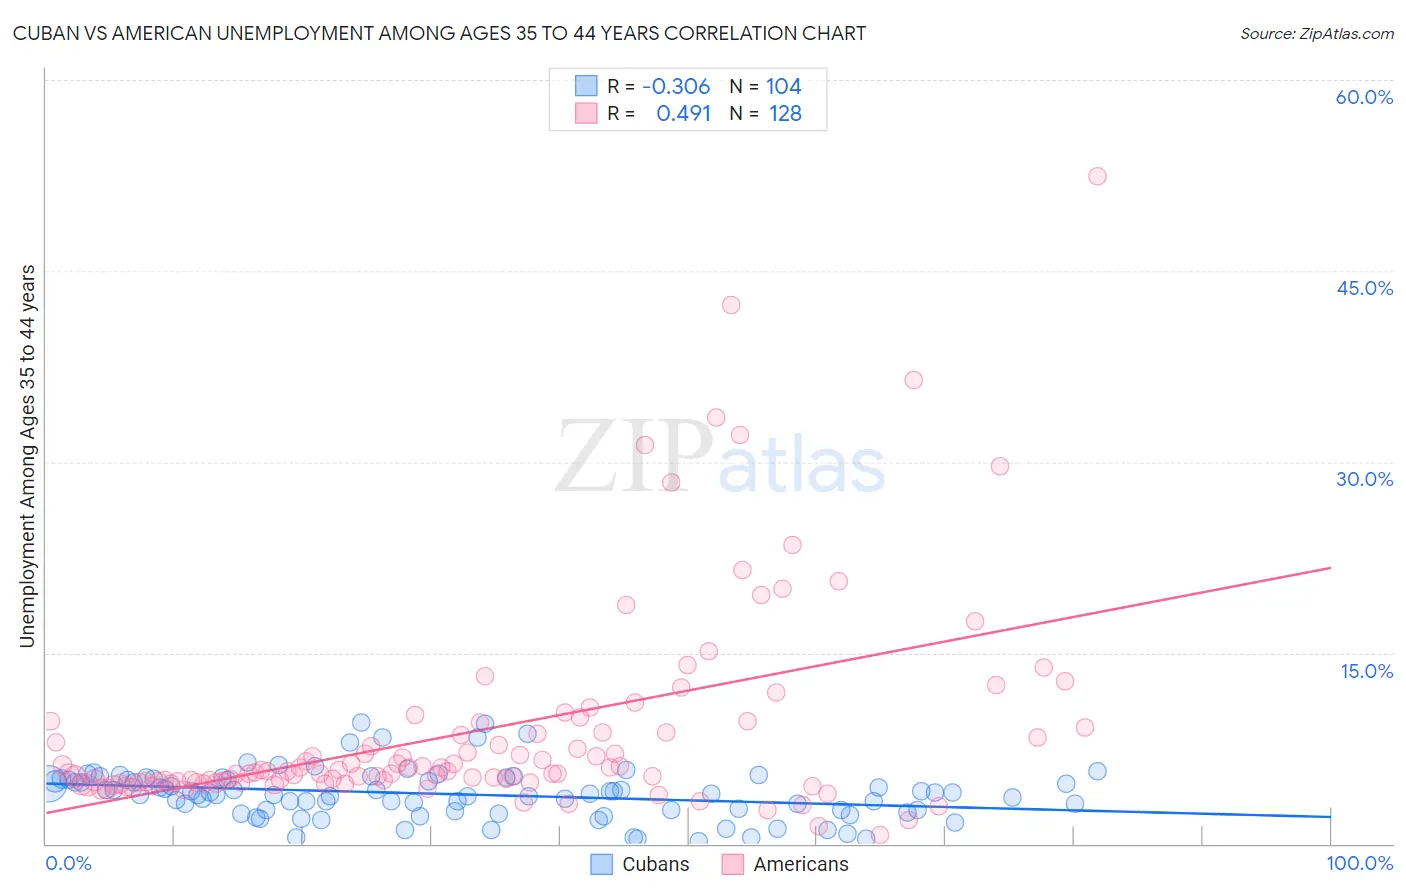
Cuban vs American Unemployment Among Ages 35 to 44 years Correlation Chart
The statistical analysis conducted on geographies consisting of 436,966,387 people shows a mild negative correlation between the proportion of Cubans and unemployment rate among population between the ages 35 and 44 in the United States with a correlation coefficient (R) of -0.306 and weighted average of 4.2%. Similarly, the statistical analysis conducted on geographies consisting of 538,964,660 people shows a moderate positive correlation between the proportion of Americans and unemployment rate among population between the ages 35 and 44 in the United States with a correlation coefficient (R) of 0.491 and weighted average of 4.9%, a difference of 17.6%.
Unemployment Among Ages 35 to 44 years Correlation Summary
| Measurement | Cuban | American |
| Minimum | 0.20% | 0.70% |
| Maximum | 9.5% | 52.4% |
| Range | 9.3% | 51.7% |
| Mean | 3.9% | 8.9% |
| Median | 3.9% | 5.7% |
| Interquartile 25% (IQ1) | 2.6% | 4.8% |
| Interquartile 75% (IQ3) | 5.0% | 8.9% |
| Interquartile Range (IQR) | 2.4% | 4.1% |
| Standard Deviation (Sample) | 1.9% | 8.3% |
| Standard Deviation (Population) | 1.9% | 8.3% |
Similar Demographics by Unemployment Among Ages 35 to 44 years
Demographics Similar to Cubans by Unemployment Among Ages 35 to 44 years
In terms of unemployment among ages 35 to 44 years, the demographic groups most similar to Cubans are Swedish (4.2%, a difference of 0.010%), Latvian (4.2%, a difference of 0.020%), Immigrants from Nepal (4.2%, a difference of 0.29%), Immigrants from Bolivia (4.2%, a difference of 0.54%), and Tongan (4.2%, a difference of 0.77%).
| Demographics | Rating | Rank | Unemployment Among Ages 35 to 44 years |
| Danes | 99.9 /100 | #9 | Exceptional 4.1% |
| Immigrants | Singapore | 99.9 /100 | #10 | Exceptional 4.1% |
| Sudanese | 99.9 /100 | #11 | Exceptional 4.1% |
| Venezuelans | 99.9 /100 | #12 | Exceptional 4.1% |
| Bolivians | 99.9 /100 | #13 | Exceptional 4.1% |
| Czechs | 99.9 /100 | #14 | Exceptional 4.1% |
| Tongans | 99.8 /100 | #15 | Exceptional 4.2% |
| Cubans | 99.8 /100 | #16 | Exceptional 4.2% |
| Swedes | 99.8 /100 | #17 | Exceptional 4.2% |
| Latvians | 99.8 /100 | #18 | Exceptional 4.2% |
| Immigrants | Nepal | 99.7 /100 | #19 | Exceptional 4.2% |
| Immigrants | Bolivia | 99.7 /100 | #20 | Exceptional 4.2% |
| Paraguayans | 99.6 /100 | #21 | Exceptional 4.2% |
| Scandinavians | 99.5 /100 | #22 | Exceptional 4.2% |
| Immigrants | Kuwait | 99.5 /100 | #23 | Exceptional 4.3% |
Demographics Similar to Americans by Unemployment Among Ages 35 to 44 years
In terms of unemployment among ages 35 to 44 years, the demographic groups most similar to Americans are Moroccan (4.9%, a difference of 0.040%), Chickasaw (4.9%, a difference of 0.15%), Sierra Leonean (4.9%, a difference of 0.46%), Immigrants (4.9%, a difference of 0.47%), and Immigrants from Sierra Leone (4.9%, a difference of 0.49%).
| Demographics | Rating | Rank | Unemployment Among Ages 35 to 44 years |
| Immigrants | Uruguay | 11.5 /100 | #209 | Poor 4.9% |
| Immigrants | Cameroon | 11.4 /100 | #210 | Poor 4.9% |
| Immigrants | Nonimmigrants | 9.4 /100 | #211 | Tragic 4.9% |
| Fijians | 8.7 /100 | #212 | Tragic 4.9% |
| Osage | 8.6 /100 | #213 | Tragic 4.9% |
| Immigrants | Africa | 8.2 /100 | #214 | Tragic 4.9% |
| Immigrants | Immigrants | 8.0 /100 | #215 | Tragic 4.9% |
| Americans | 6.2 /100 | #216 | Tragic 4.9% |
| Moroccans | 6.0 /100 | #217 | Tragic 4.9% |
| Chickasaw | 5.7 /100 | #218 | Tragic 4.9% |
| Sierra Leoneans | 4.8 /100 | #219 | Tragic 4.9% |
| Immigrants | Sierra Leone | 4.7 /100 | #220 | Tragic 4.9% |
| Bermudans | 3.9 /100 | #221 | Tragic 5.0% |
| Hmong | 3.5 /100 | #222 | Tragic 5.0% |
| Immigrants | Panama | 3.3 /100 | #223 | Tragic 5.0% |