Arapaho vs Marshallese No Schooling Completed

COMPARE

Arapaho
Race
Ancestry
AfghanAfricanAlaska NativeAlaskan AthabascanAlbanianAleutAlsatianAmericanApacheArabArapahoArgentineanArmenianAssyrian/Chaldean/SyriacAustralianAustrianBahamianBangladeshiBarbadianBasqueBelgianBelizeanBermudanBhutaneseBlackfeetBolivianBrazilianBritishBritish West IndianBulgarianBurmeseCajunCambodianCanadianCape VerdeanCarpatho RusynCelticCentral AmericanCentral American IndianCherokeeCheyenneChickasawChileanChineseChippewaChoctawColombianColvilleComancheCosta RicanCreeCreekCroatianCrowCubanCypriotCzechCzechoslovakianDanishDelawareDominicanDutchDutch West IndianEastern EuropeanEcuadorianEgyptianEnglishEstonianEthiopianEuropeanFijianFilipinoFinnishFrenchFrench American IndianFrench CanadianGermanGerman RussianGhanaianGreekGuamanian/ChamorroGuatemalanGuyaneseHaitianHmongHonduranHopiHoumaHungarianIcelanderIndian (Asian)IndonesianInupiatIranianIraqiIrishIroquoisIsraeliItalianJamaicanJapaneseJordanianKenyanKiowaKoreanLaotianLatvianLebaneseLiberianLithuanianLumbeeLuxembourgerMacedonianMalaysianMalteseMenomineeMexicanMexican American IndianMongolianMoroccanNative HawaiianNavajoNepaleseNew ZealanderNicaraguanNigerianNorthern EuropeanNorwegianOkinawanOsageOttawaPaiutePakistaniPalestinianPanamanianParaguayanPennsylvania GermanPeruvianPimaPolishPortuguesePotawatomiPuebloPuerto RicanPuget Sound SalishRomanianRussianSalvadoranSamoanScandinavianScotch-IrishScottishSeminoleSenegaleseSerbianShoshoneSierra LeoneanSiouxSlavicSlovakSloveneSomaliSouth AfricanSouth AmericanSouth American IndianSoviet UnionSpaniardSpanishSpanish AmericanSpanish American IndianSri LankanSubsaharan AfricanSudaneseSwedishSwissSyrianTaiwaneseThaiTlingit-HaidaTohono O'OdhamTonganTrinidadian and TobagonianTsimshianTurkishU.S. Virgin IslanderUgandanUkrainianUruguayanUteVenezuelanVietnameseWelshWest IndianYakamaYaquiYugoslavianYumanYup'ikZimbabwean
Immigration
NonimmigrantsImmigrantsAfghanistanAfricaAlbaniaArgentinaArmeniaAsiaAustraliaAustriaBahamasBangladeshBarbadosBelarusBelgiumBelizeBoliviaBosnia and HerzegovinaBrazilBulgariaBurma/MyanmarCabo VerdeCambodiaCameroonCanadaCaribbeanCentral AmericaChileChinaColombiaCongoCosta RicaCroatiaCubaCzechoslovakiaDenmarkDominicaDominican RepublicEastern AfricaEastern AsiaEastern EuropeEcuadorEgyptEl SalvadorEnglandEritreaEthiopiaEuropeFijiFranceGermanyGhanaGreeceGrenadaGuatemalaGuyanaHaitiHondurasHong KongHungaryIndiaIndonesiaIranIraqIrelandIsraelItalyJamaicaJapanJordanKazakhstanKenyaKoreaKuwaitLaosLatin AmericaLatviaLebanonLiberiaLithuaniaMalaysiaMexicoMicronesiaMiddle AfricaMoldovaMoroccoNepalNetherlandsNicaraguaNigeriaNorth AmericaNorth MacedoniaNorthern AfricaNorthern EuropeNorwayOceaniaPakistanPanamaPeruPhilippinesPolandPortugalRomaniaRussiaSaudi ArabiaScotlandSenegalSerbiaSierra LeoneSingaporeSomaliaSouth AfricaSouth AmericaSouth Central AsiaSouth Eastern AsiaSouthern EuropeSpainSri LankaSt. Vincent and the GrenadinesSudanSwedenSwitzerlandSyriaTaiwanThailandTrinidad and TobagoTurkeyUgandaUkraineUruguayUzbekistanVenezuelaVietnamWest IndiesWestern AfricaWestern AsiaWestern EuropeYemenZaireZimbabweAzores
Marshallese
Race
Ancestry
AfghanAfricanAlaska NativeAlaskan AthabascanAlbanianAleutAlsatianAmericanApacheArabArgentineanArmenianAssyrian/Chaldean/SyriacAustralianAustrianBahamianBangladeshiBarbadianBasqueBelgianBelizeanBermudanBhutaneseBlackfeetBolivianBrazilianBritishBritish West IndianBulgarianBurmeseCajunCambodianCanadianCape VerdeanCarpatho RusynCelticCentral AmericanCentral American IndianCherokeeCheyenneChickasawChileanChineseChippewaChoctawColombianColvilleComancheCosta RicanCreeCreekCroatianCrowCubanCypriotCzechCzechoslovakianDanishDelawareDominicanDutchDutch West IndianEastern EuropeanEcuadorianEgyptianEnglishEstonianEthiopianEuropeanFijianFilipinoFinnishFrenchFrench American IndianFrench CanadianGermanGerman RussianGhanaianGreekGuamanian/ChamorroGuatemalanGuyaneseHaitianHmongHonduranHopiHoumaHungarianIcelanderIndian (Asian)IndonesianInupiatIranianIraqiIrishIroquoisIsraeliItalianJamaicanJapaneseJordanianKenyanKiowaKoreanLaotianLatvianLebaneseLiberianLithuanianLumbeeLuxembourgerMacedonianMalaysianMalteseMarshalleseMenomineeMexicanMexican American IndianMongolianMoroccanNative HawaiianNavajoNepaleseNew ZealanderNicaraguanNigerianNorthern EuropeanNorwegianOkinawanOsageOttawaPaiutePakistaniPalestinianPanamanianParaguayanPennsylvania GermanPeruvianPimaPolishPortuguesePotawatomiPuebloPuerto RicanPuget Sound SalishRomanianRussianSalvadoranSamoanScandinavianScotch-IrishScottishSeminoleSenegaleseSerbianShoshoneSierra LeoneanSiouxSlavicSlovakSloveneSomaliSouth AfricanSouth AmericanSouth American IndianSoviet UnionSpaniardSpanishSpanish AmericanSpanish American IndianSri LankanSubsaharan AfricanSudaneseSwedishSwissSyrianTaiwaneseThaiTlingit-HaidaTohono O'OdhamTonganTrinidadian and TobagonianTsimshianTurkishU.S. Virgin IslanderUgandanUkrainianUruguayanUteVenezuelanVietnameseWelshWest IndianYakamaYaquiYugoslavianYumanYup'ikZimbabwean
Immigration
NonimmigrantsImmigrantsAfghanistanAfricaAlbaniaArgentinaArmeniaAsiaAustraliaAustriaBahamasBangladeshBarbadosBelarusBelgiumBelizeBoliviaBosnia and HerzegovinaBrazilBulgariaBurma/MyanmarCabo VerdeCambodiaCameroonCanadaCaribbeanCentral AmericaChileChinaColombiaCongoCosta RicaCroatiaCubaCzechoslovakiaDenmarkDominicaDominican RepublicEastern AfricaEastern AsiaEastern EuropeEcuadorEgyptEl SalvadorEnglandEritreaEthiopiaEuropeFijiFranceGermanyGhanaGreeceGrenadaGuatemalaGuyanaHaitiHondurasHong KongHungaryIndiaIndonesiaIranIraqIrelandIsraelItalyJamaicaJapanJordanKazakhstanKenyaKoreaKuwaitLaosLatin AmericaLatviaLebanonLiberiaLithuaniaMalaysiaMexicoMicronesiaMiddle AfricaMoldovaMoroccoNepalNetherlandsNicaraguaNigeriaNorth AmericaNorth MacedoniaNorthern AfricaNorthern EuropeNorwayOceaniaPakistanPanamaPeruPhilippinesPolandPortugalRomaniaRussiaSaudi ArabiaScotlandSenegalSerbiaSierra LeoneSingaporeSomaliaSouth AfricaSouth AmericaSouth Central AsiaSouth Eastern AsiaSouthern EuropeSpainSri LankaSt. Vincent and the GrenadinesSudanSwedenSwitzerlandSyriaTaiwanThailandTrinidad and TobagoTurkeyUgandaUkraineUruguayUzbekistanVenezuelaVietnamWest IndiesWestern AfricaWestern AsiaWestern EuropeYemenZaireZimbabweAzores
No Schooling Completed
Income
Poverty
Unemployment
Labor Participation
Family Structure
Vehicle Availability
Education Level
Disability

No Schooling Completed Comparison

Arapaho

Marshallese

Average
Excellent
2.1%
NO SCHOOLING COMPLETED
45.0/ 100
METRIC RATING
177th/ 347
METRIC RANK
2.0%
NO SCHOOLING COMPLETED
83.5/ 100
METRIC RATING
140th/ 347
METRIC RANK

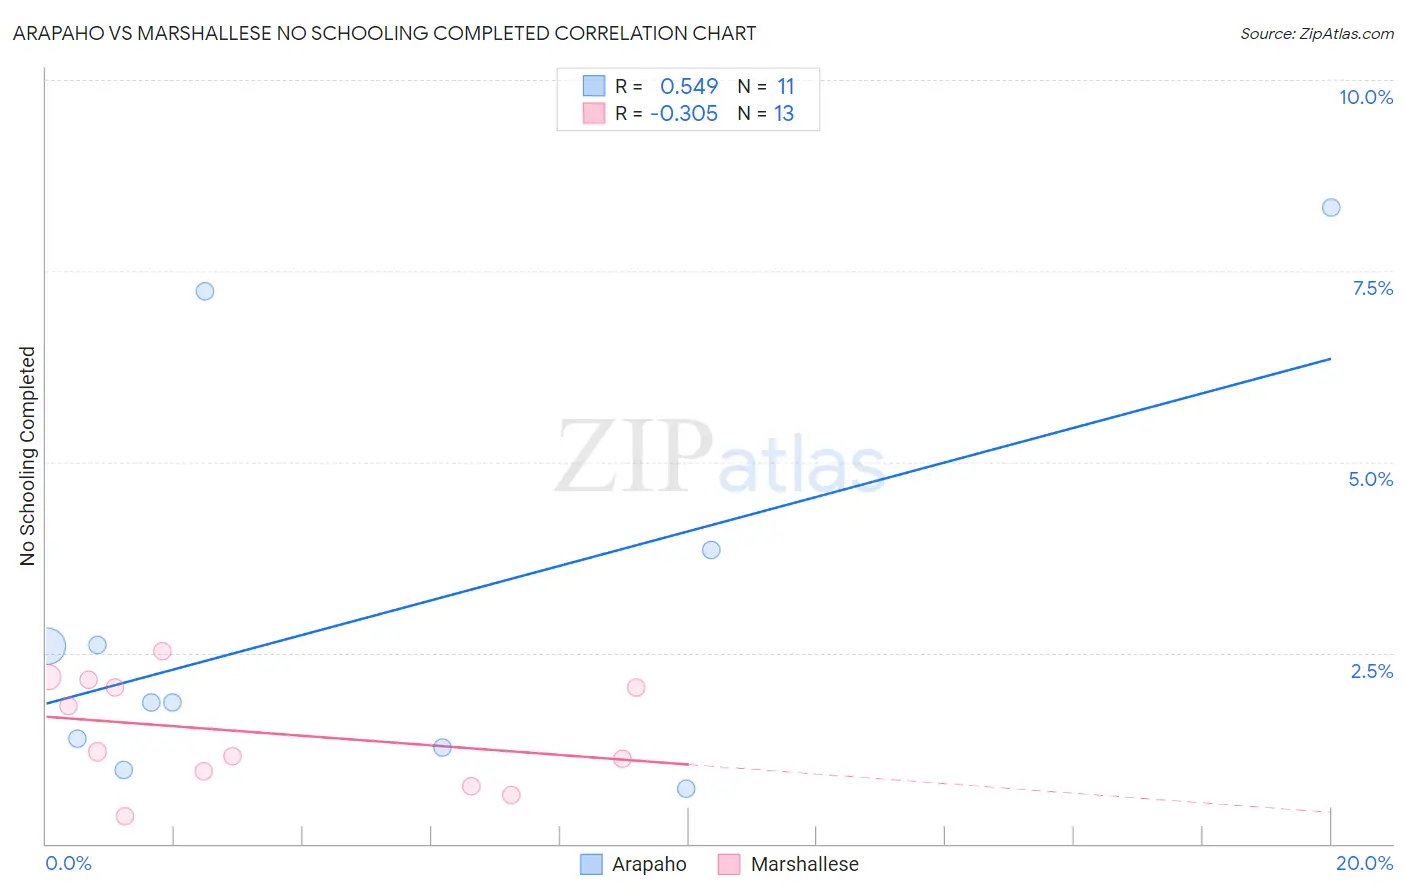
Arapaho vs Marshallese No Schooling Completed Correlation Chart

The statistical analysis conducted on geographies consisting of 29,619,913 people shows a substantial positive correlation between the proportion of Arapaho and percentage of population with no schooling in the United States with a correlation coefficient (R) of 0.549 and weighted average of 2.1%. Similarly, the statistical analysis conducted on geographies consisting of 14,733,291 people shows a mild negative correlation between the proportion of Marshallese and percentage of population with no schooling in the United States with a correlation coefficient (R) of -0.305 and weighted average of 2.0%, a difference of 6.5%.
Arapaho vs Marshallese No Schooling Completed

No Schooling Completed Correlation Summary

MeasurementArapahoMarshallese
Minimum0.72%0.36%
Maximum8.3%2.5%
Range7.6%2.1%
Mean3.0%1.5%
Median1.9%1.2%
Interquartile 25% (IQ1)1.3%0.85%
Interquartile 75% (IQ3)3.8%2.1%
Interquartile Range (IQR)2.6%1.2%
Standard Deviation (Sample)2.5%0.70%
Standard Deviation (Population)2.4%0.67%

Similar Demographics by No Schooling Completed

Demographics Similar to Arapaho by No Schooling Completed

In terms of no schooling completed, the demographic groups most similar to Arapaho are Panamanian (2.1%, a difference of 0.020%), Pakistani (2.1%, a difference of 0.040%), Immigrants from Kazakhstan (2.1%, a difference of 0.10%), Portuguese (2.1%, a difference of 0.16%), and Arab (2.1%, a difference of 0.19%).
DemographicsRating | RankNo Schooling Completed
Argentineans
56.0
/100
|
#170
Average
2.1%
Immigrants | Poland
55.2
/100
|
#171
Average
2.1%
Immigrants | Argentina
52.7
/100
|
#172
Average
2.1%
Immigrants | Belarus
51.8
/100
|
#173
Average
2.1%
Immigrants | Micronesia
50.0
/100
|
#174
Average
2.1%
Arabs
46.4
/100
|
#175
Average
2.1%
Panamanians
45.2
/100
|
#176
Average
2.1%
Arapaho
45.0
/100
|
#177
Average
2.1%
Pakistanis
44.7
/100
|
#178
Average
2.1%
Immigrants | Kazakhstan
44.3
/100
|
#179
Average
2.1%
Portuguese
43.9
/100
|
#180
Average
2.1%
Immigrants | Taiwan
42.6
/100
|
#181
Average
2.1%
French American Indians
42.2
/100
|
#182
Average
2.1%
Blacks/African Americans
41.4
/100
|
#183
Average
2.1%
Pima
41.3
/100
|
#184
Average
2.1%

Demographics Similar to Marshallese by No Schooling Completed

In terms of no schooling completed, the demographic groups most similar to Marshallese are Immigrants from Greece (2.0%, a difference of 0.010%), Jordanian (2.0%, a difference of 0.26%), Venezuelan (2.0%, a difference of 0.50%), Immigrants from Israel (2.0%, a difference of 0.51%), and Filipino (2.0%, a difference of 0.55%).
DemographicsRating | RankNo Schooling Completed
Immigrants | Turkey
90.2
/100
|
#133
Exceptional
1.9%
Menominee
89.6
/100
|
#134
Excellent
1.9%
Hmong
88.5
/100
|
#135
Excellent
1.9%
Burmese
88.2
/100
|
#136
Excellent
1.9%
Filipinos
85.5
/100
|
#137
Excellent
2.0%
Immigrants | Israel
85.4
/100
|
#138
Excellent
2.0%
Jordanians
84.5
/100
|
#139
Excellent
2.0%
Marshallese
83.5
/100
|
#140
Excellent
2.0%
Immigrants | Greece
83.5
/100
|
#141
Excellent
2.0%
Venezuelans
81.5
/100
|
#142
Excellent
2.0%
Immigrants | South Central Asia
80.0
/100
|
#143
Good
2.0%
Alsatians
79.1
/100
|
#144
Good
2.0%
Immigrants | Iran
79.0
/100
|
#145
Good
2.0%
Immigrants | Moldova
78.0
/100
|
#146
Good
2.0%
Soviet Union
77.1
/100
|
#147
Good
2.0%